Census Vintage 2025 population estimates for 19,483 U.S. cities and places, reference date July 1, 2025. A national percentage-change map, resident-count comparison map, fastest growth, biggest numeric gains, state briefs, milestone crossings, and reusable downloads for reporters and editors.
For reporters: the ZIP includes PNG/SVG maps, chart exports, captions, alt text, source manifest, data dictionary, and CSVs.
SourceU.S. Census Bureau Population Estimates Program
VintageV2025
Reference2025-07-01
Coverage50 states + DC · 19,483 rows
Growth window2024 to 2025 within V2025
Last build2026-06-17
Read before using
Reporter trust notes
What the numbers are
These are Census Bureau Vintage 2025 July 1 population estimates. The Census embargo notice listed Thursday, May 14, 2026 at 12:01 a.m. ET as the public release time for the city and town estimates.
The Atlas compares July 1, 2024 and July 1, 2025 estimates inside the same vintage. It is not a net-migration table, a decennial count, or a long-run trend line.
How to cite it
Cite the Census Bureau as the primary source for population estimates. Cite Every City in the USA when using our rankings, maps, state packets, chart exports, or joined story leads.
Source: U.S. Census Bureau Vintage 2025 estimates. Graphics and analysis: Every City in the USA. Reuse allowed under CC BY 4.0; note if modified.
Universe and map count
This page contains 19,483 city/place rows and the all-city map draws 19,483 dots. Clean contiguous U.S. crops omit Alaska and Hawaii by design.
The Census city/town release includes multiple local-government geography types; this Atlas uses the site's processed city/place universe. See methodology before using it as a geography-definition source.
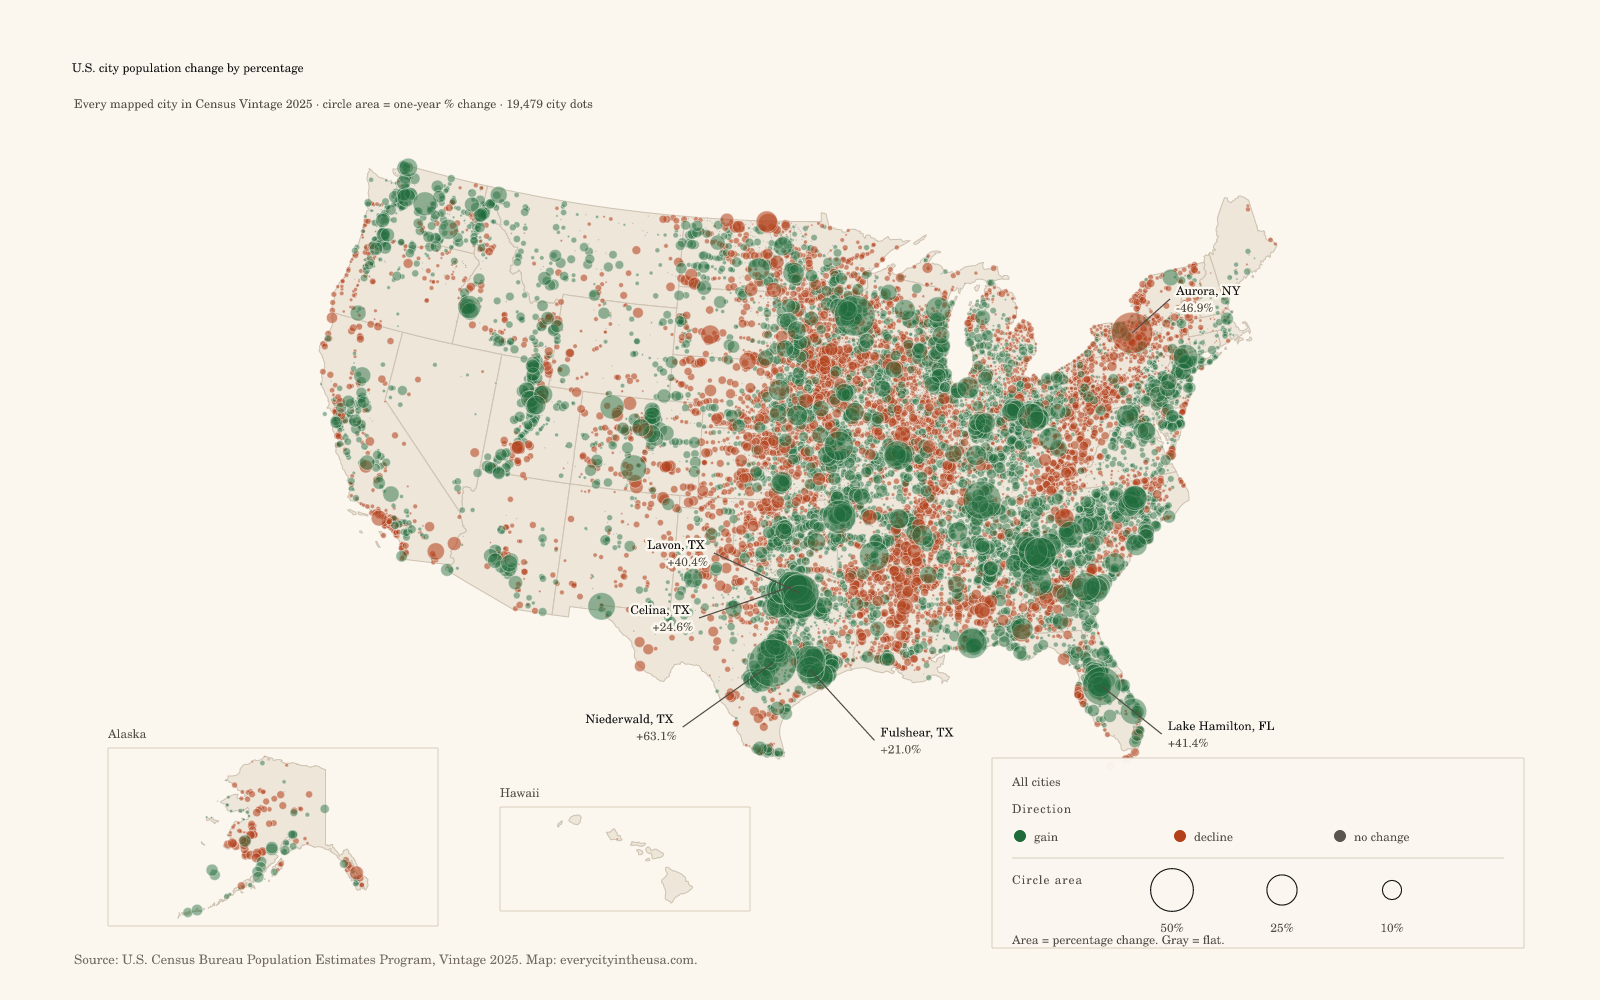
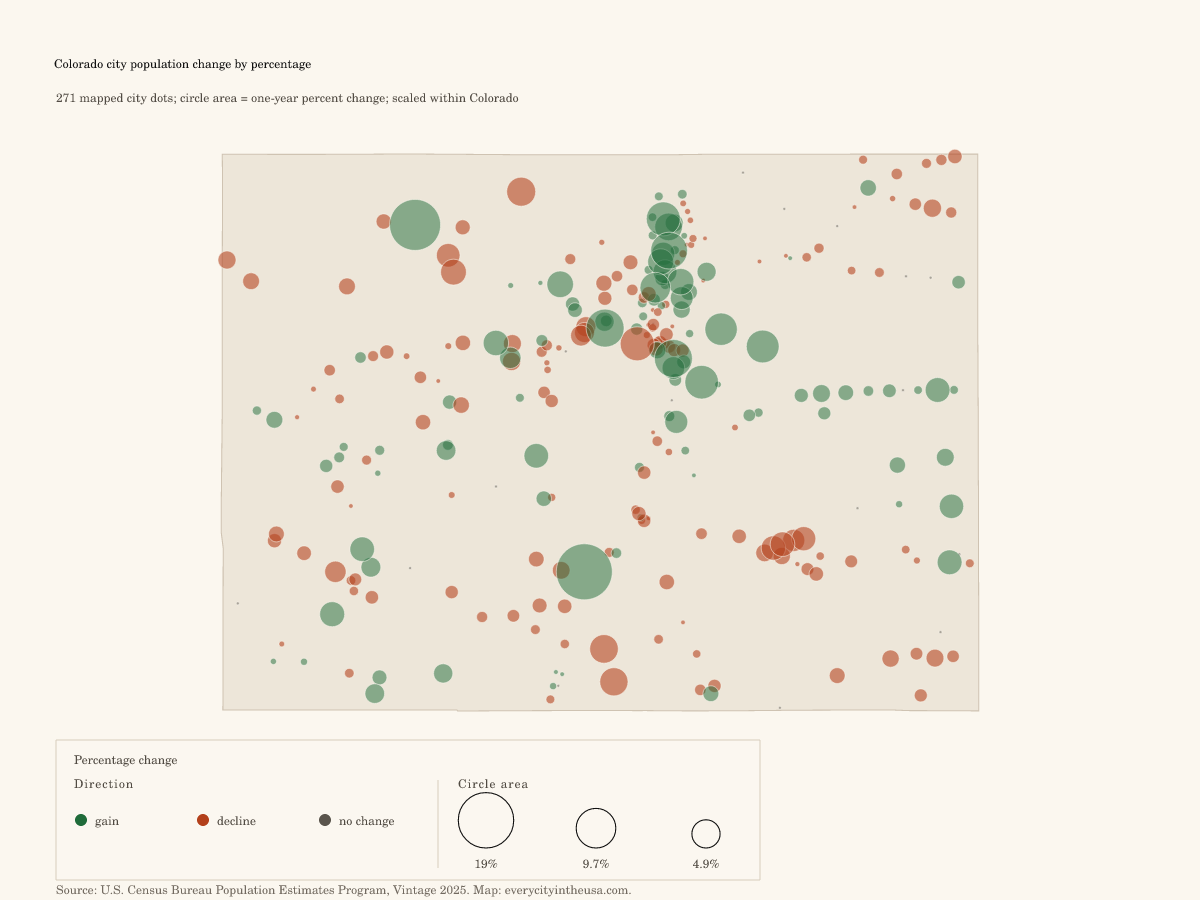
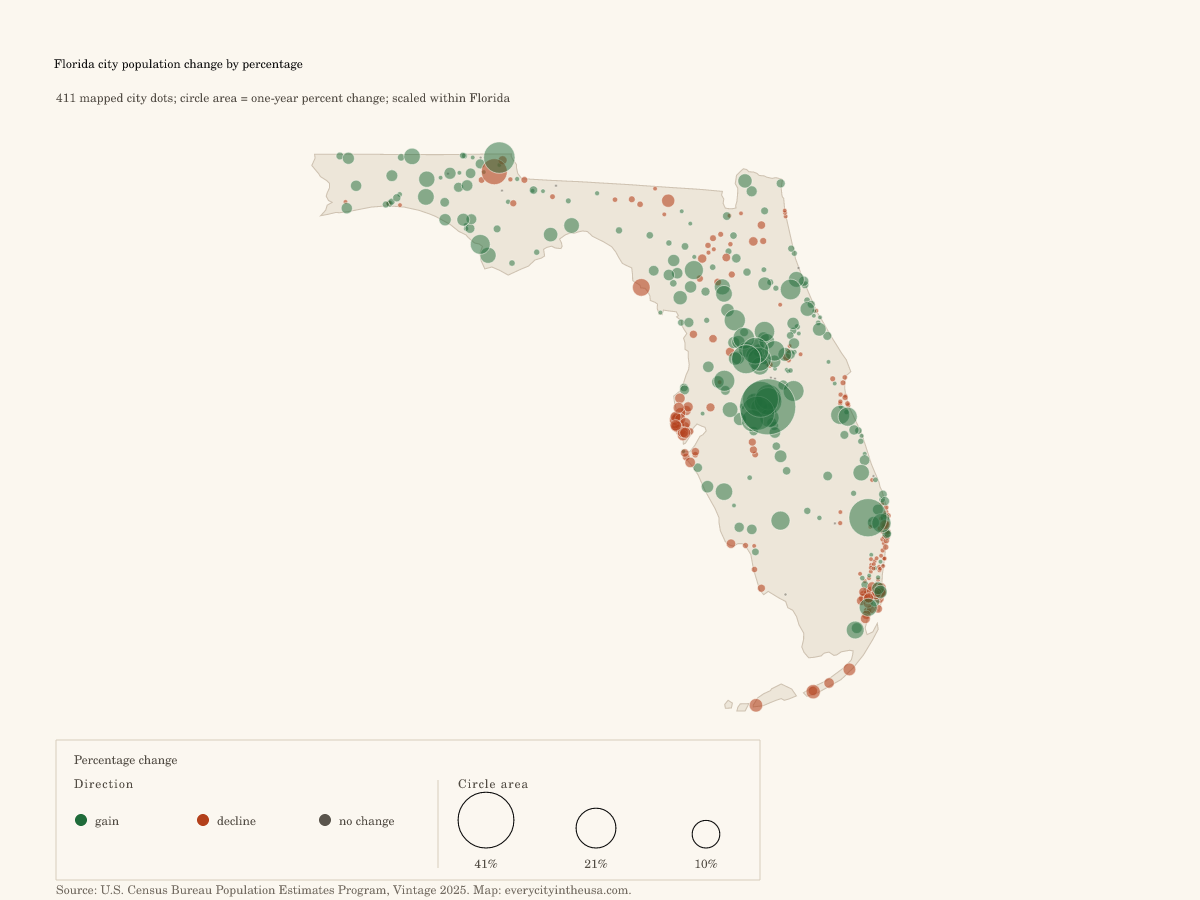
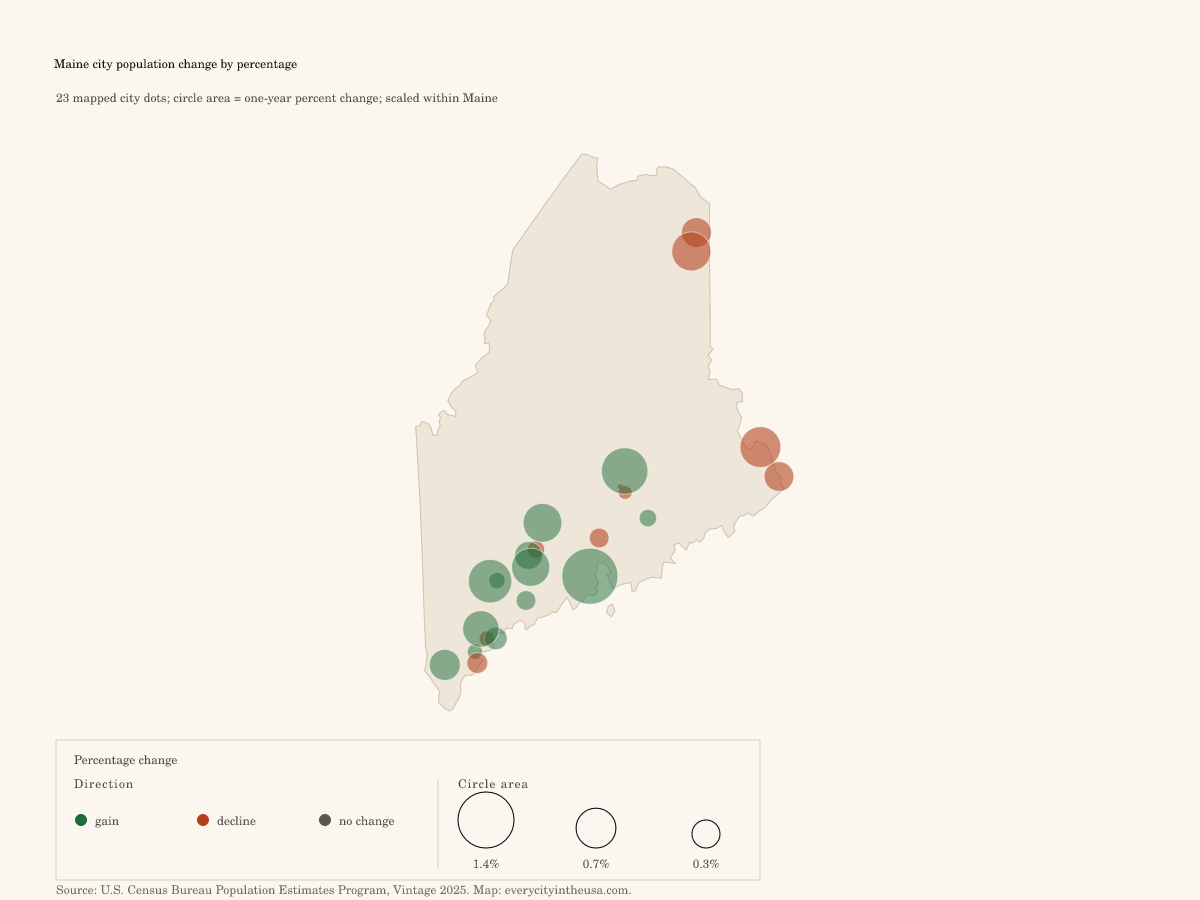
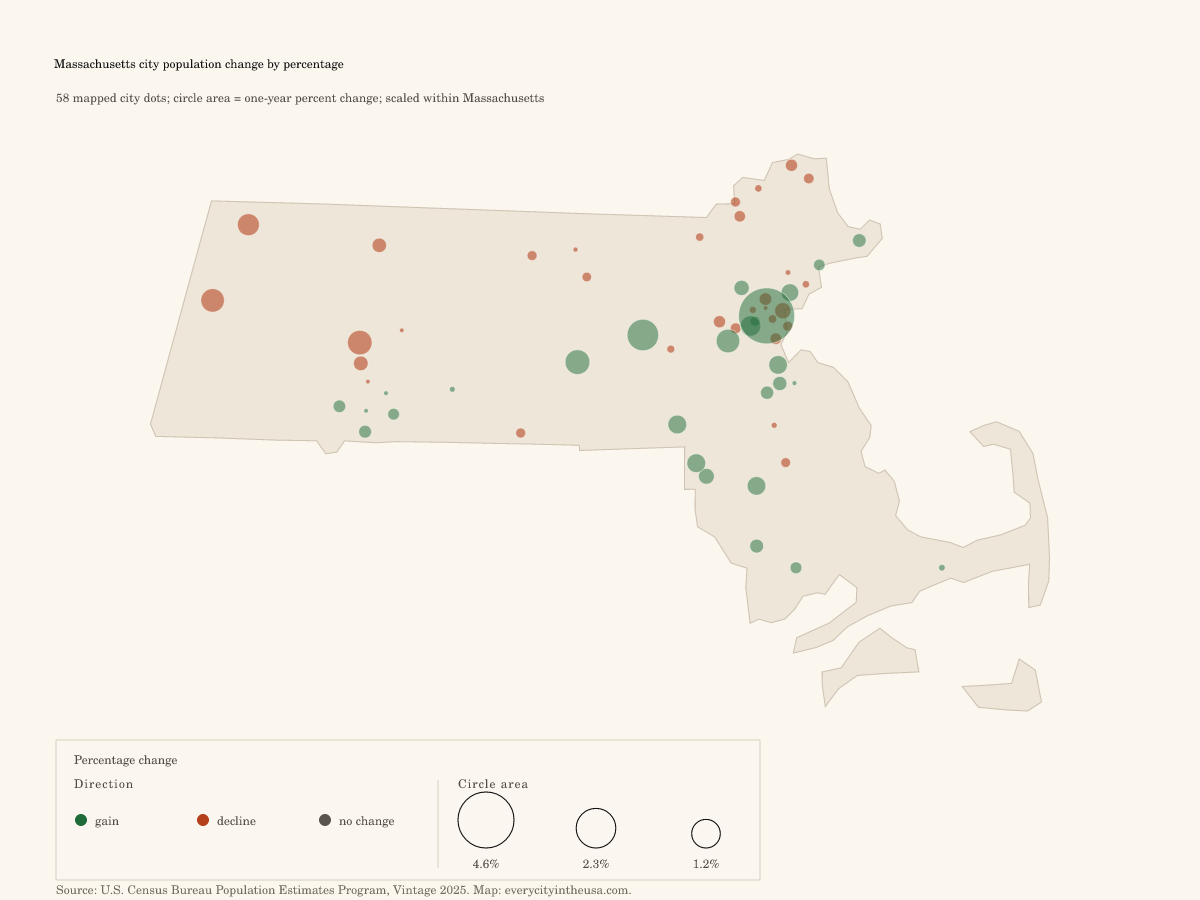
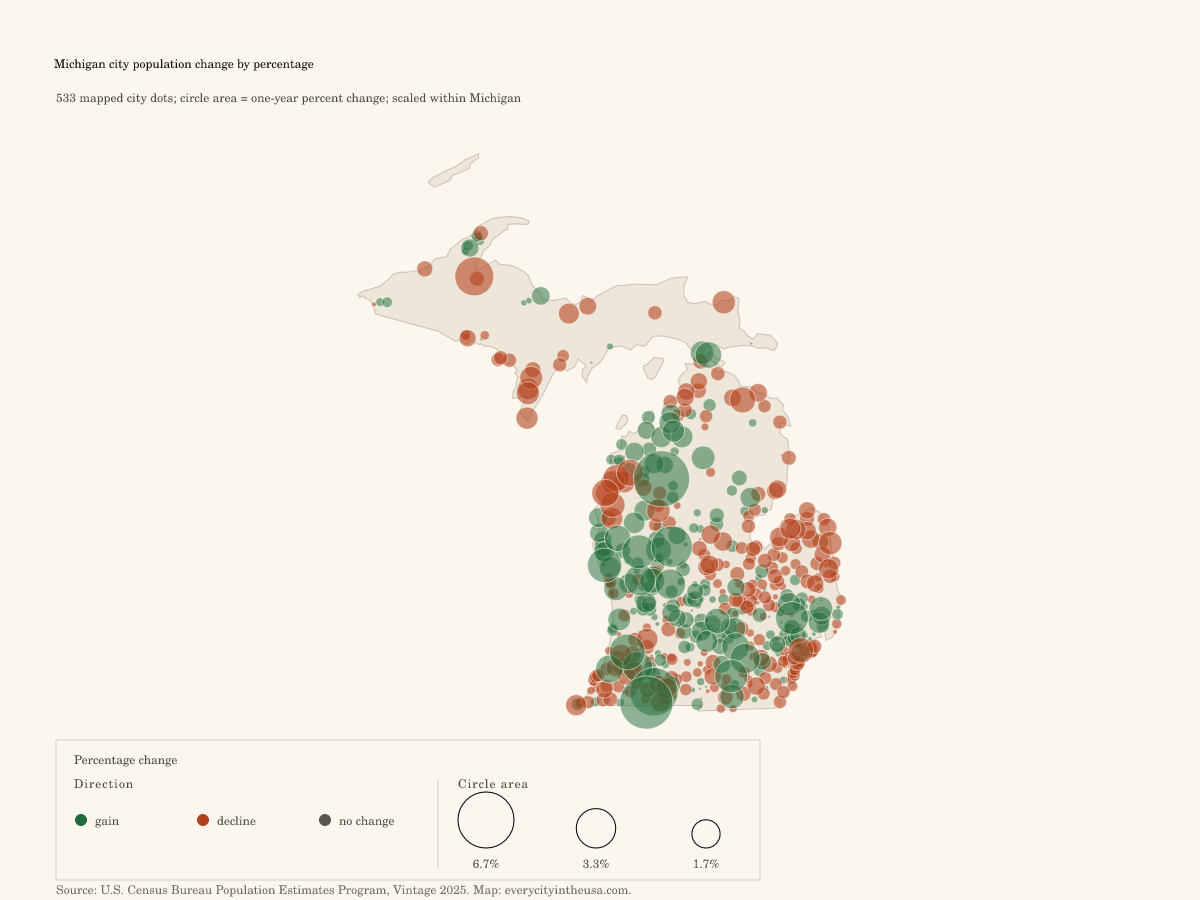
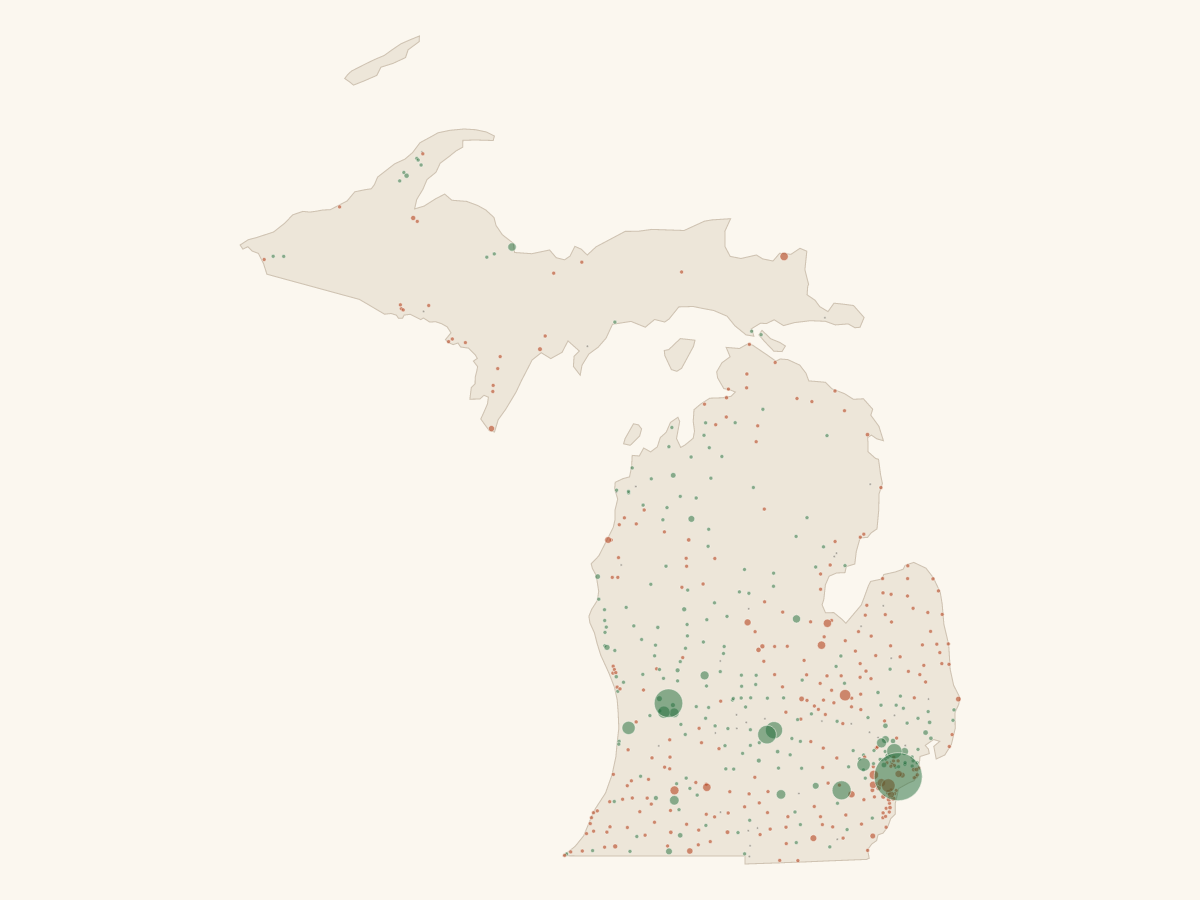
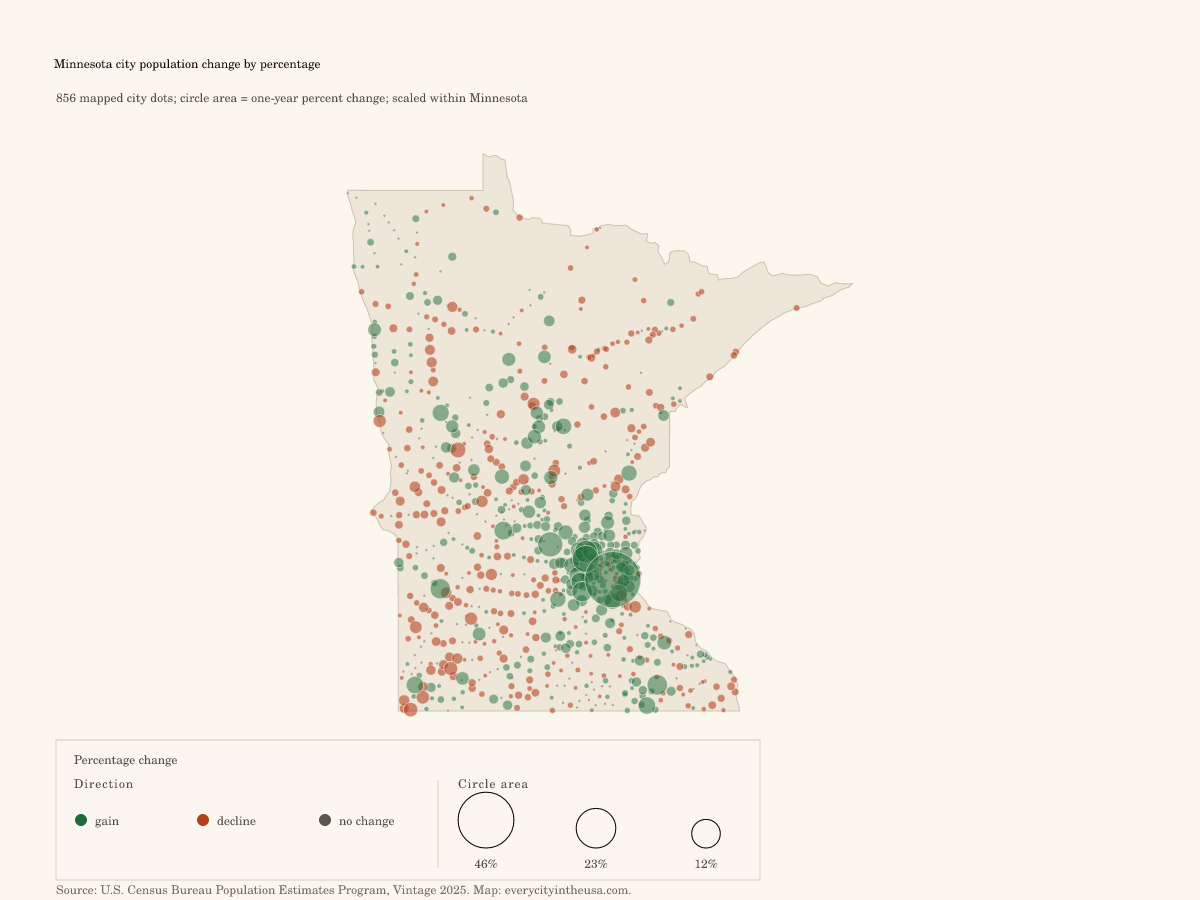
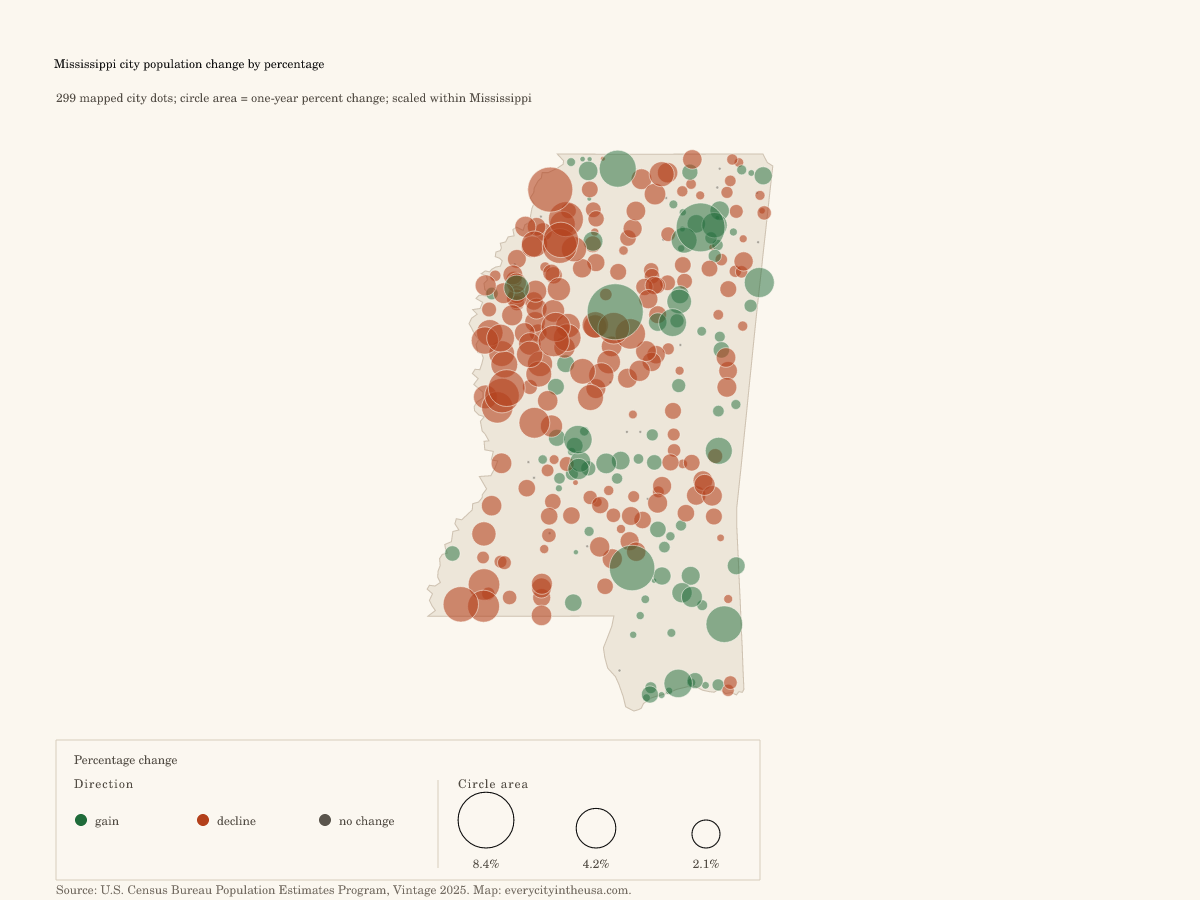
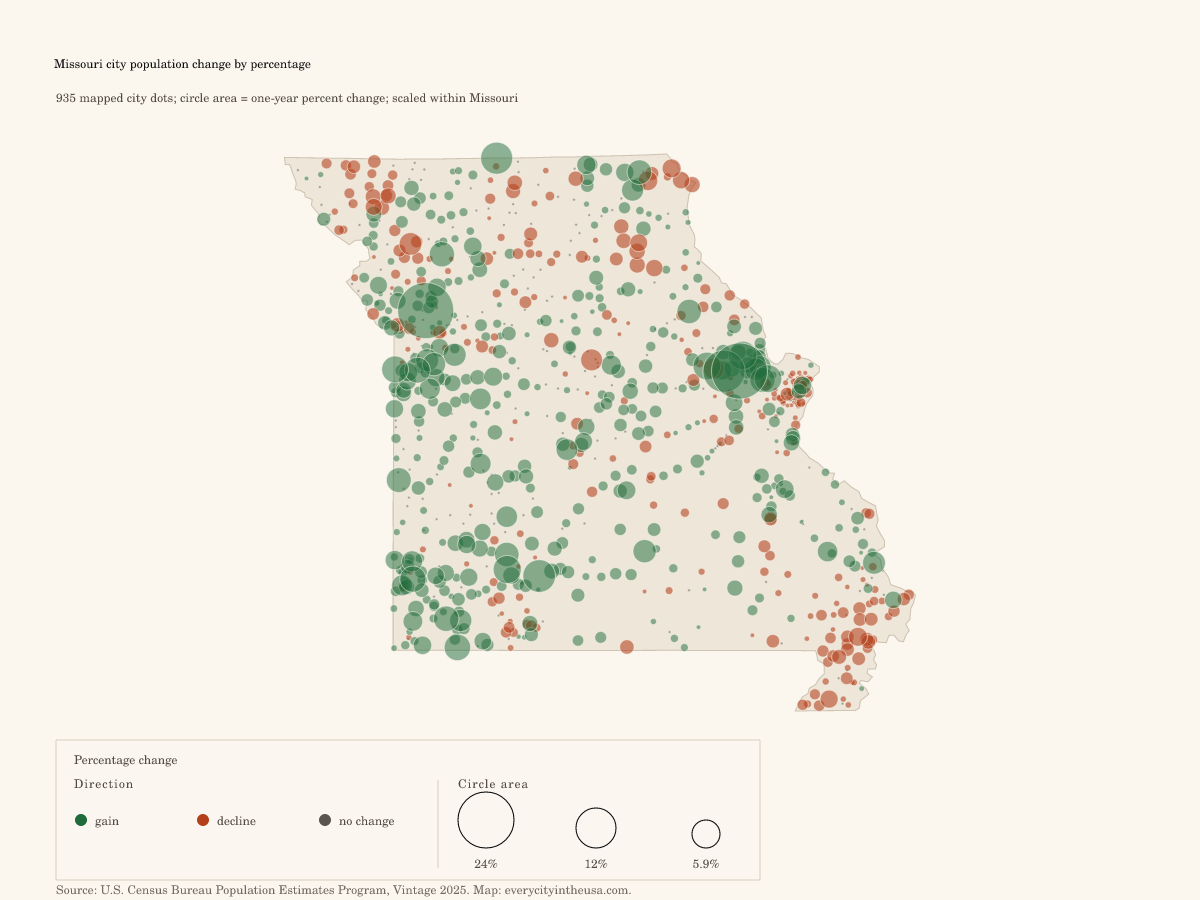
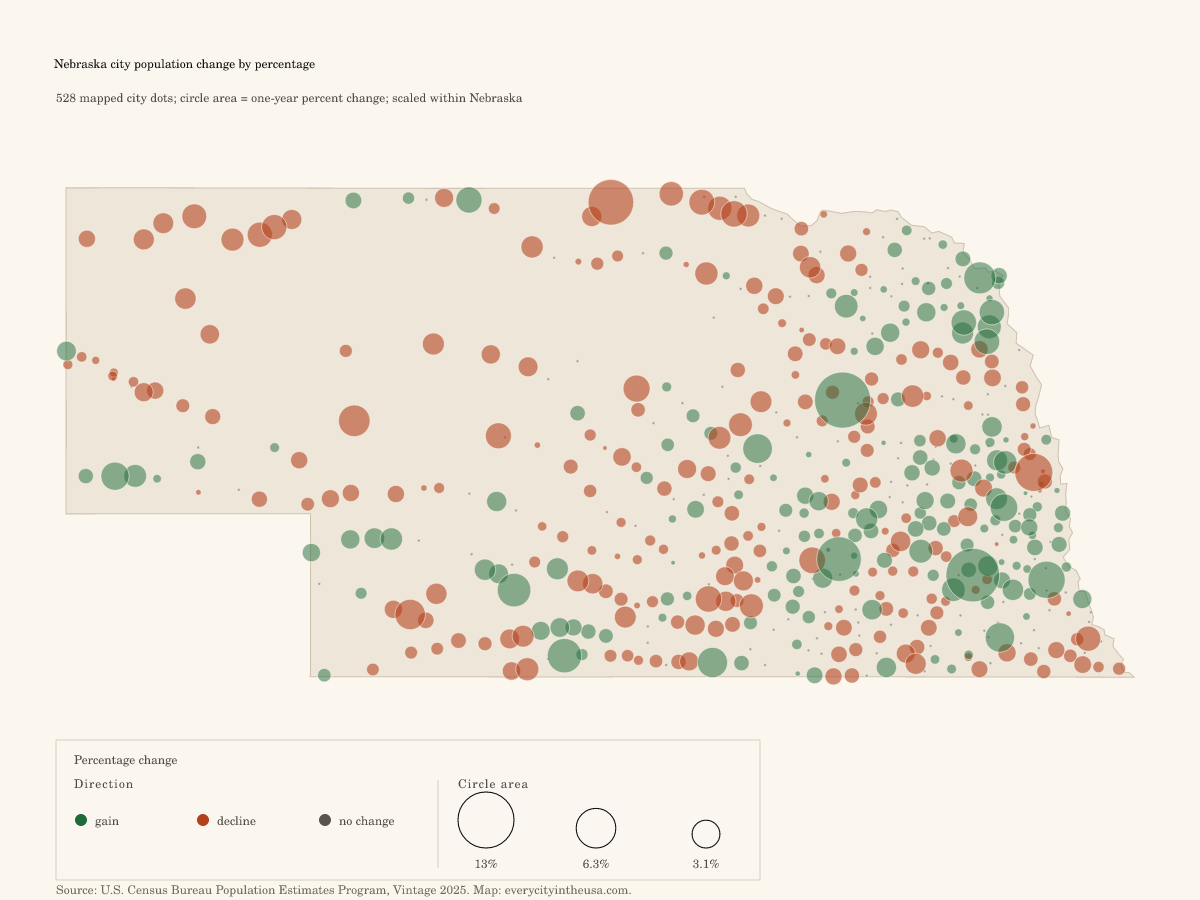
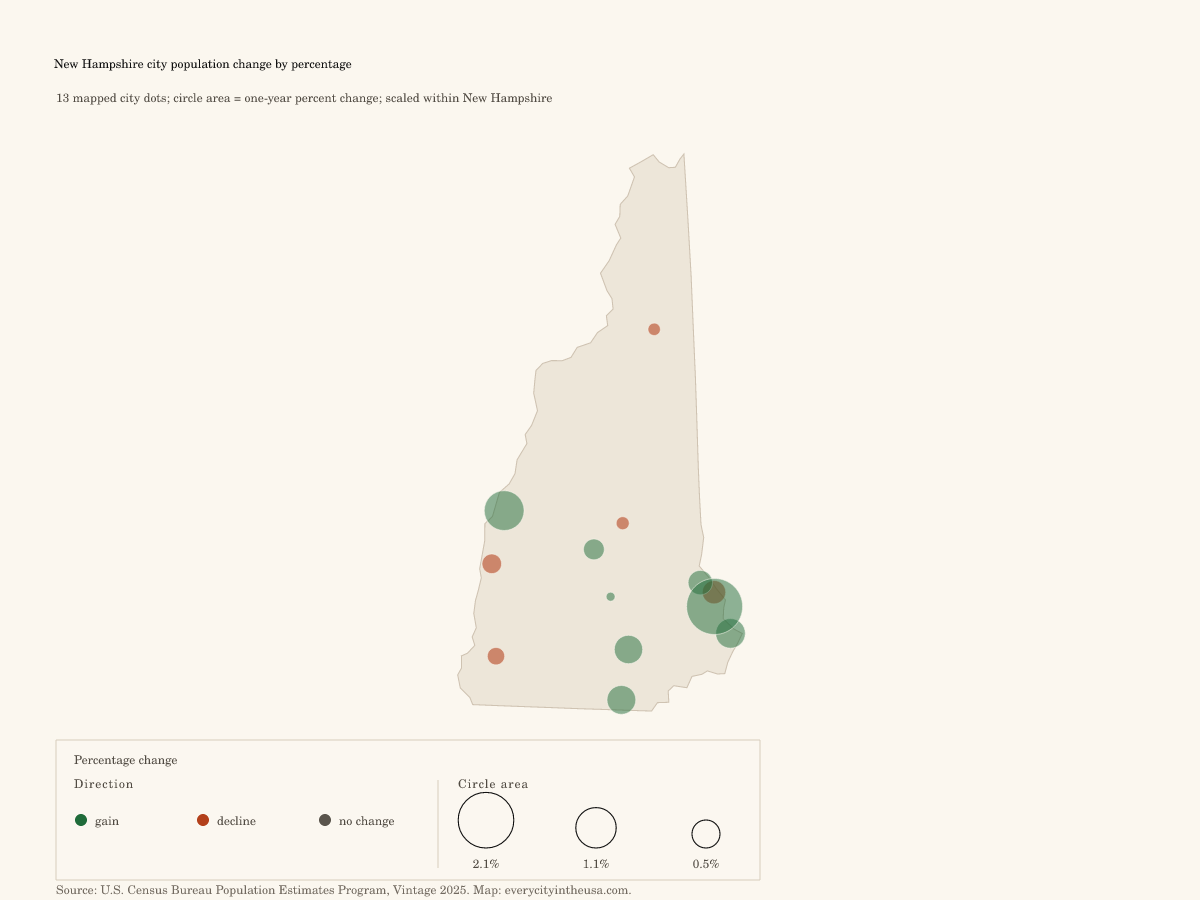
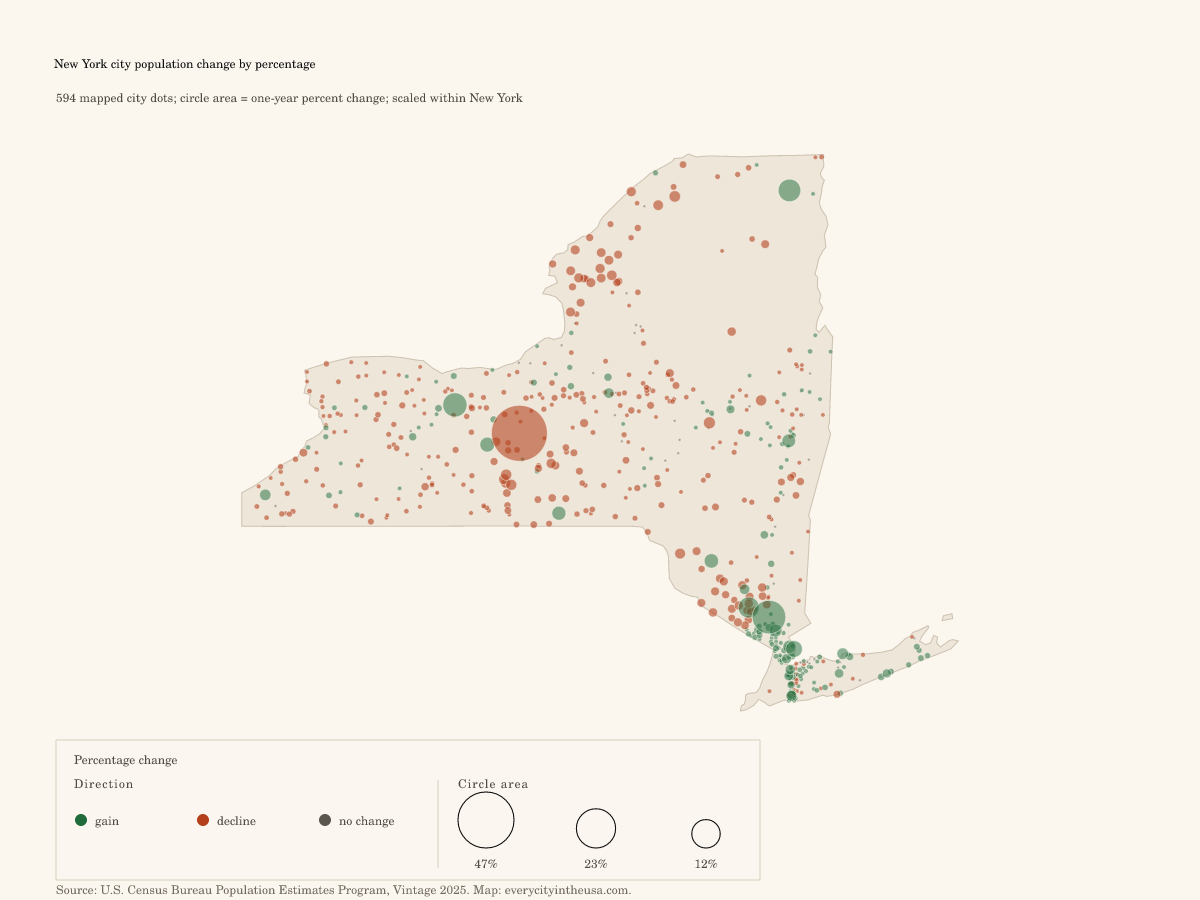
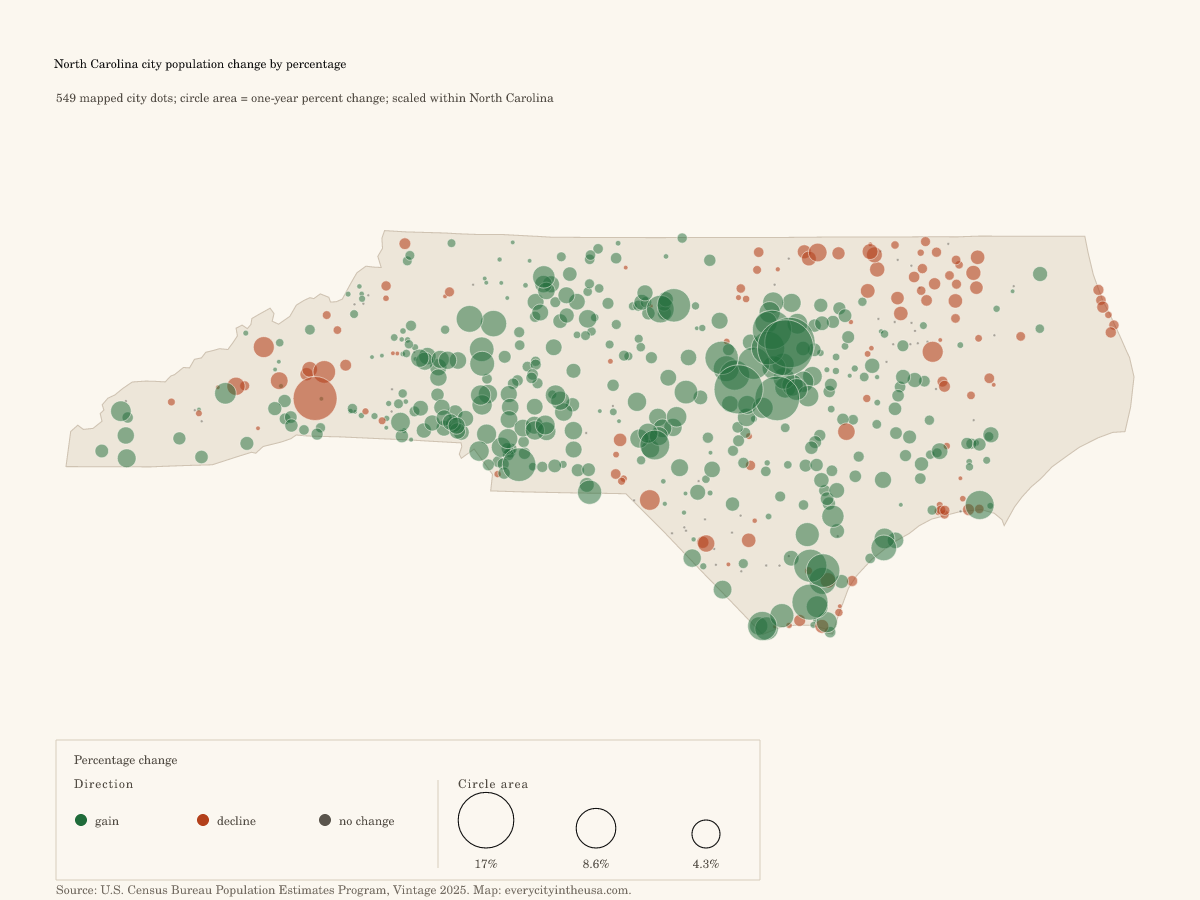
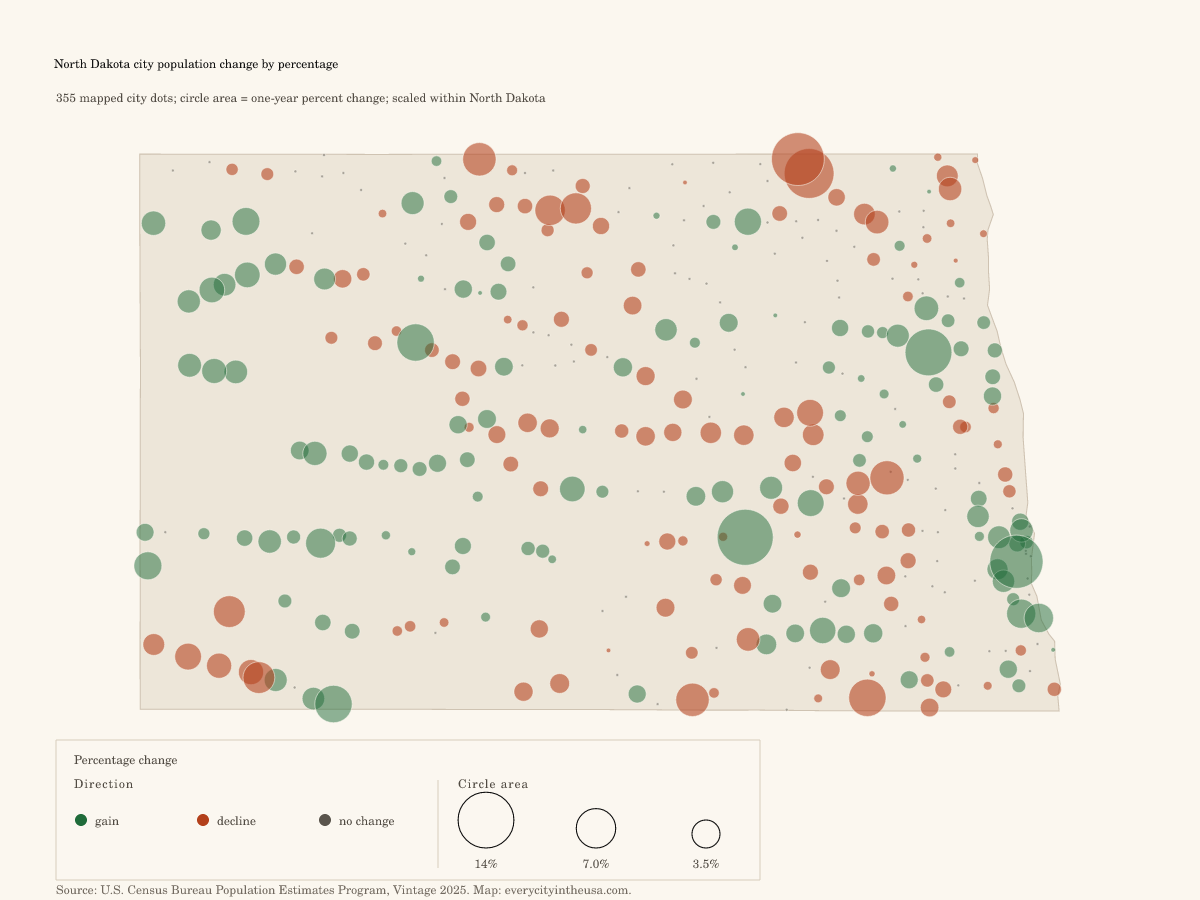
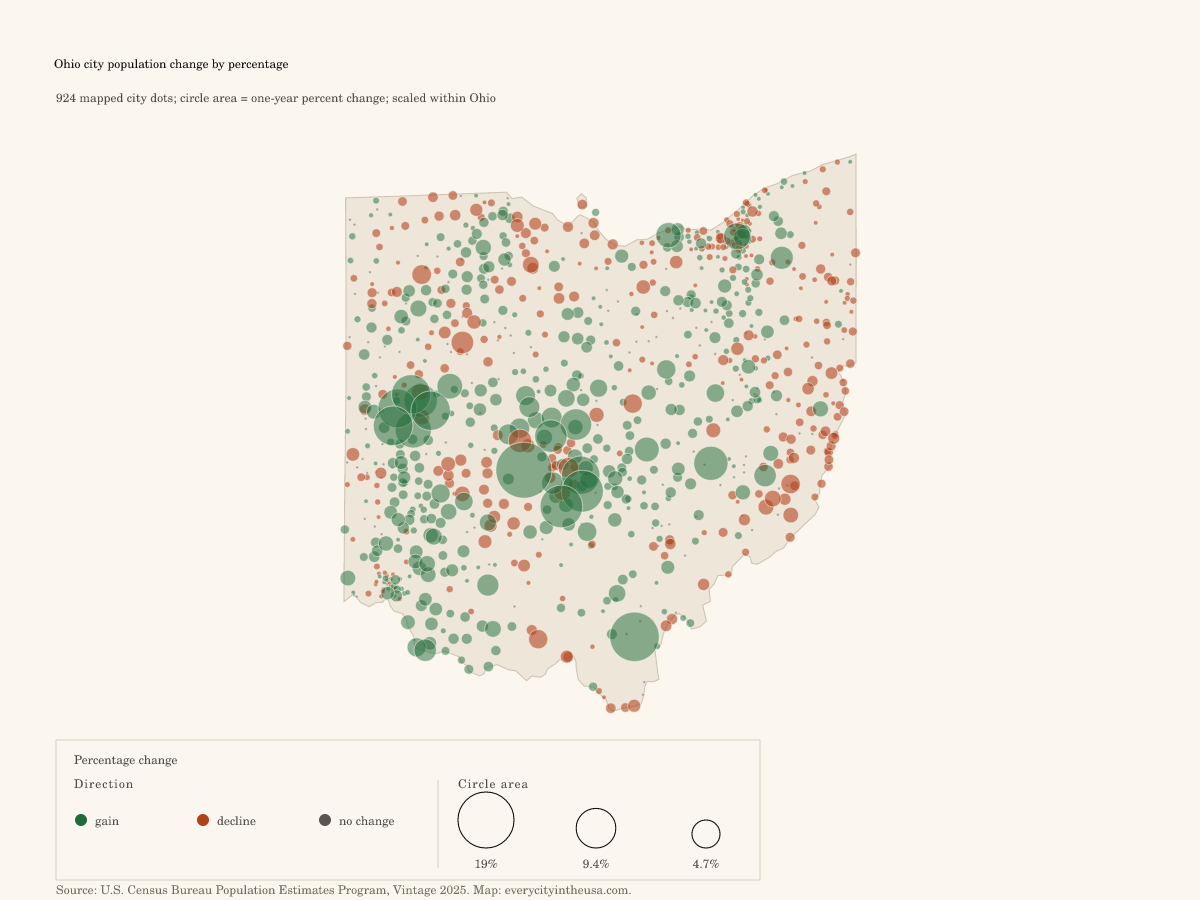
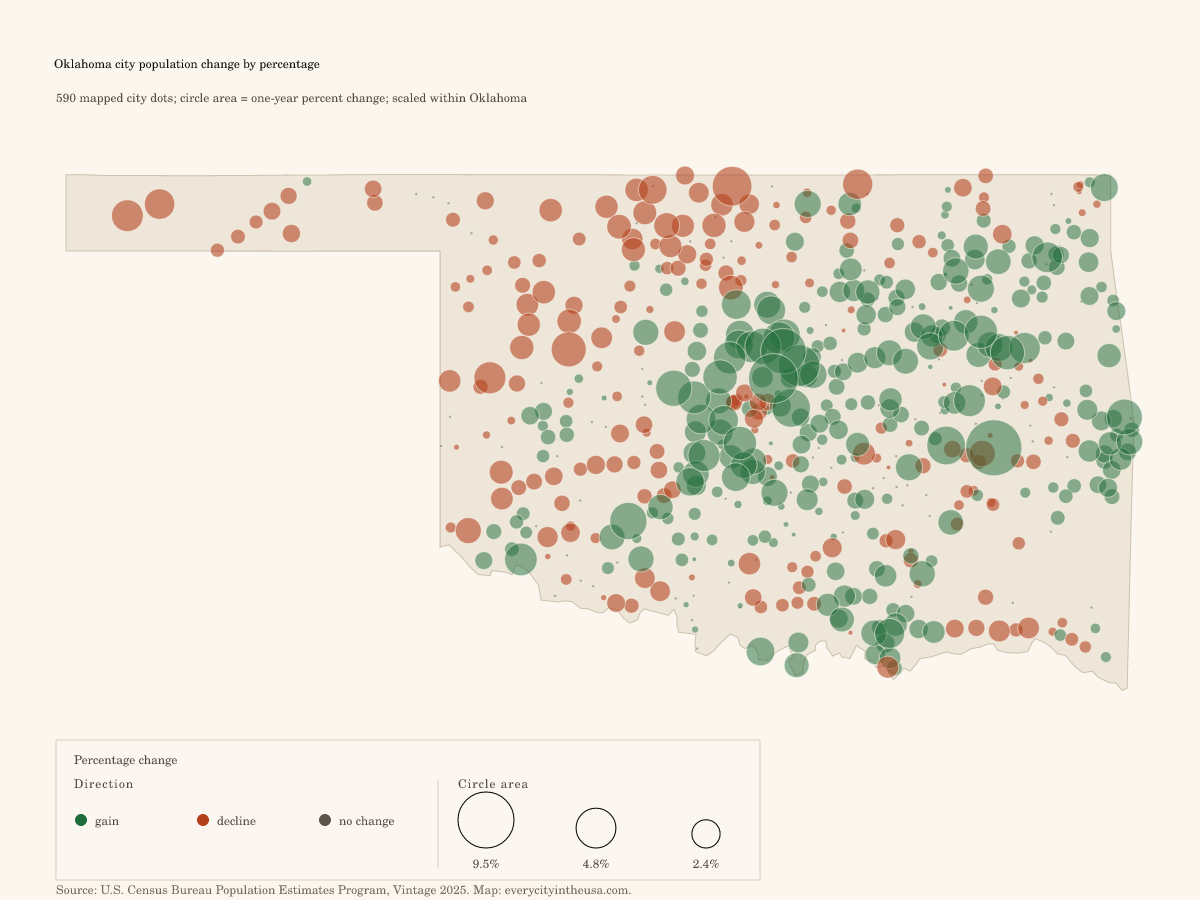
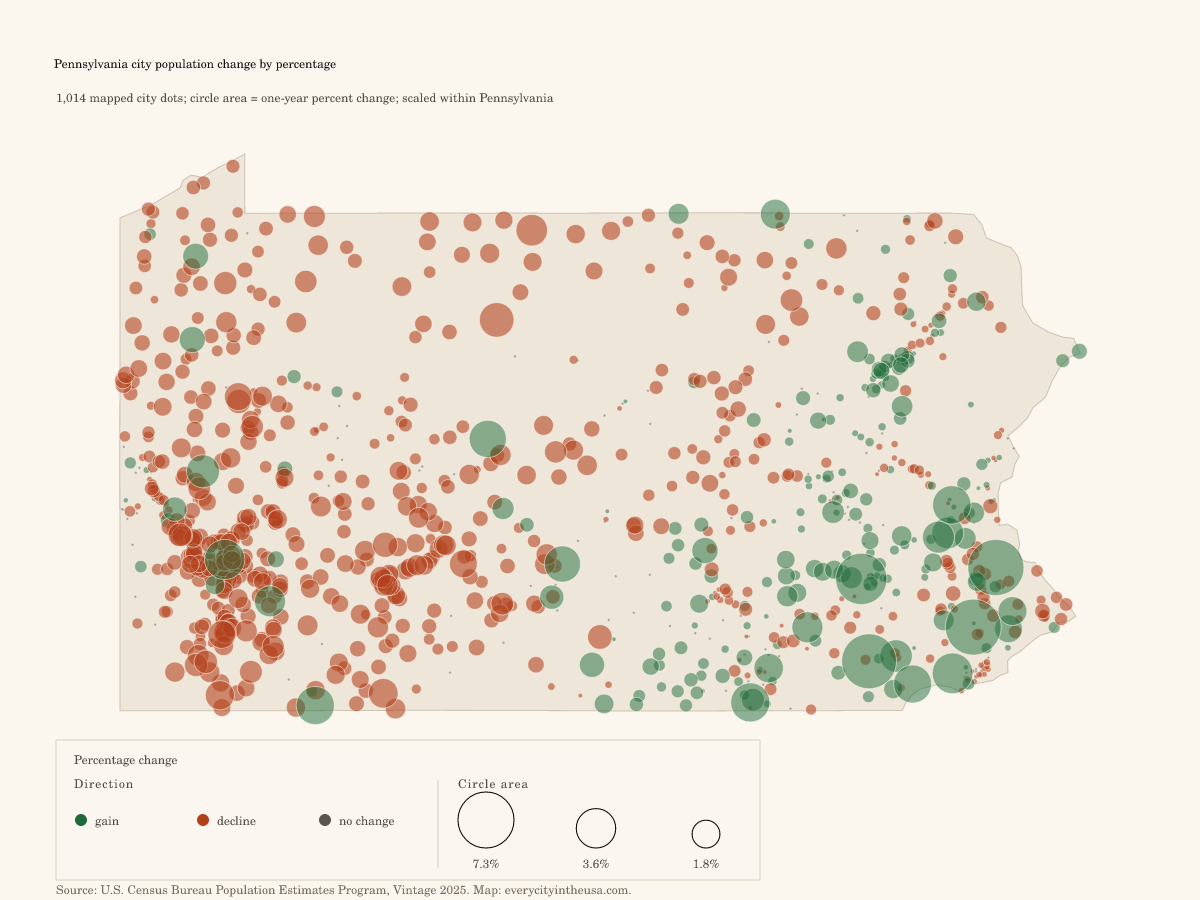
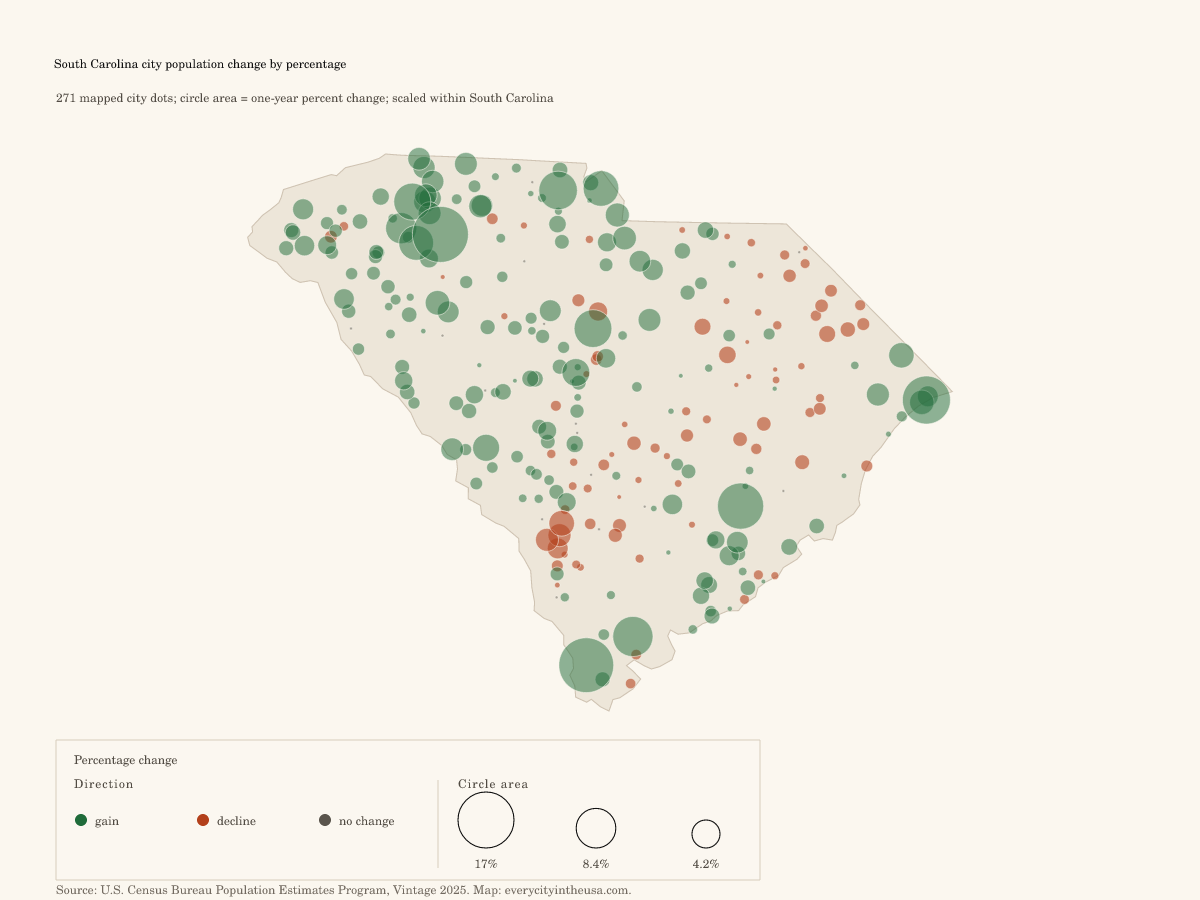
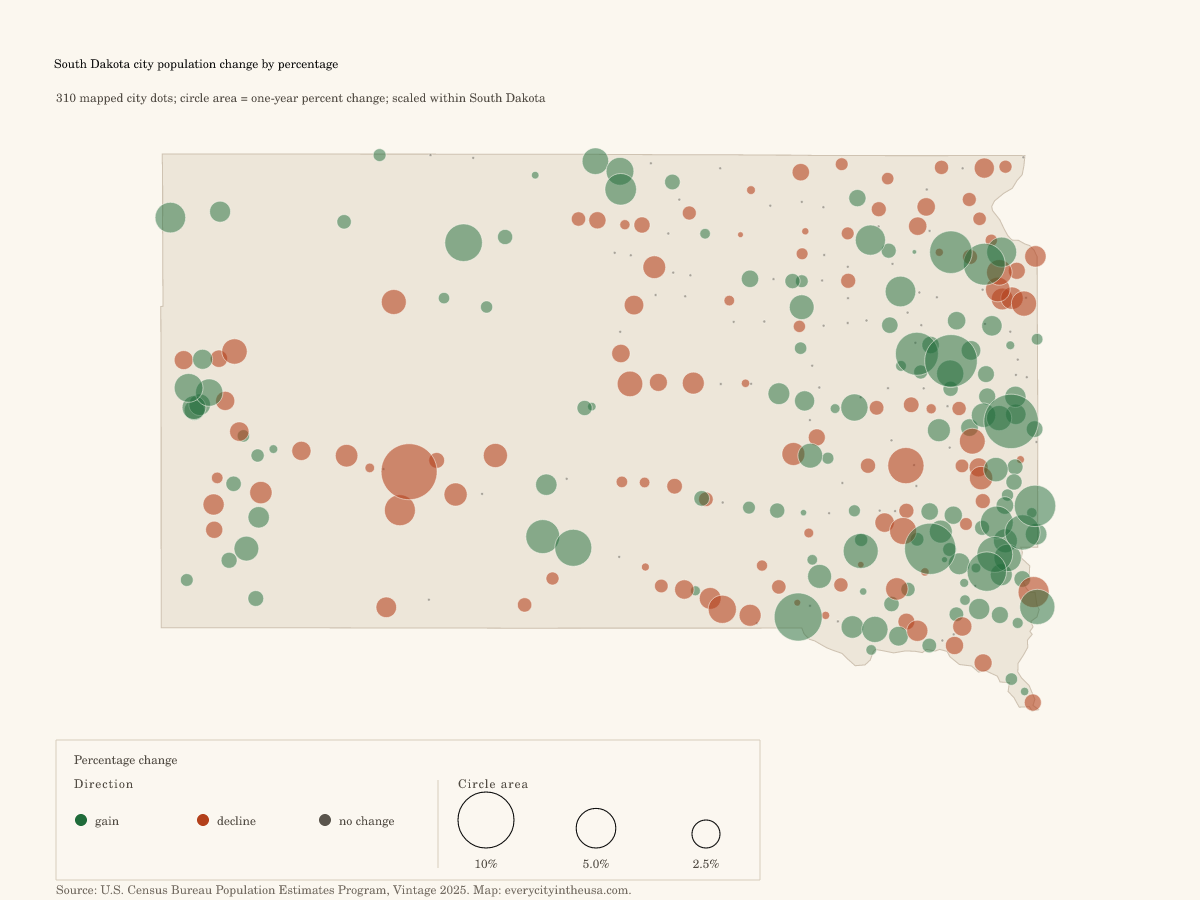
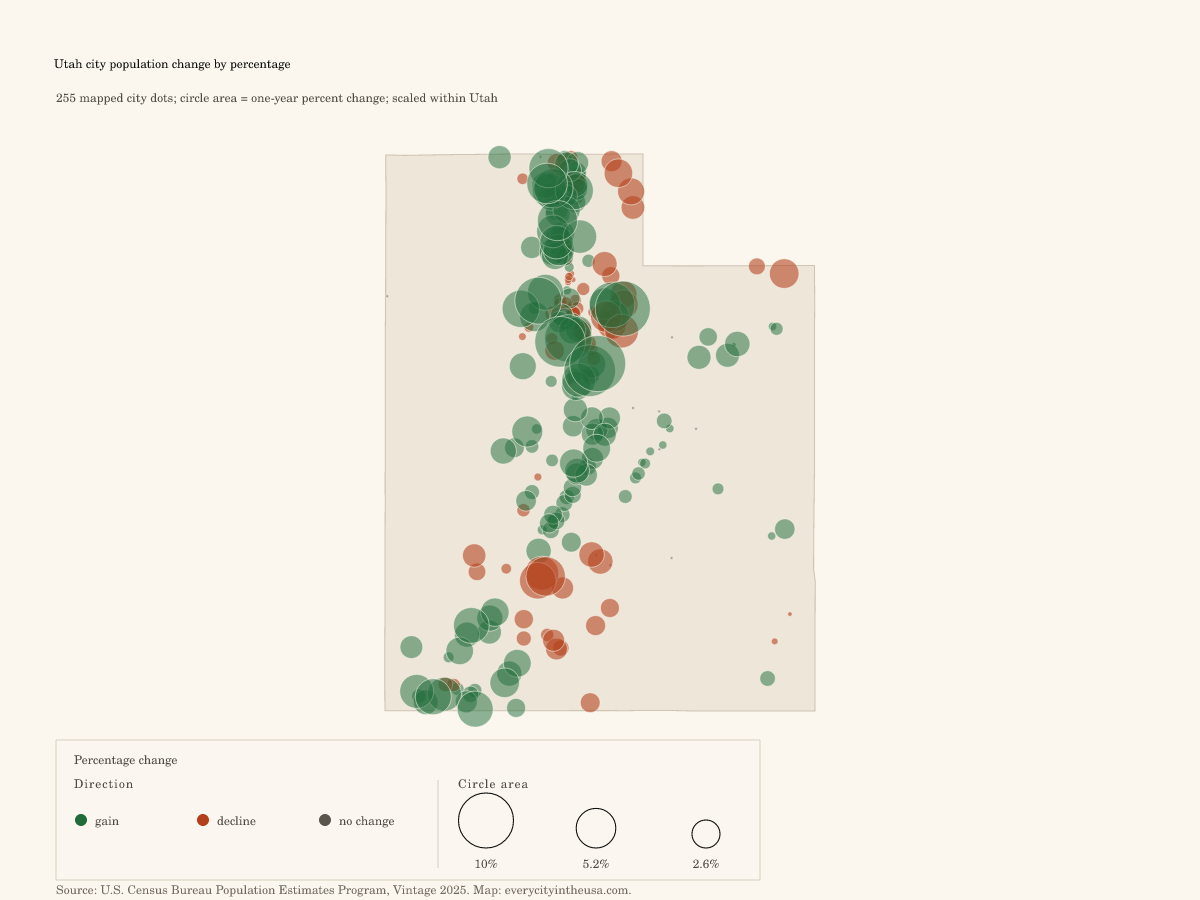
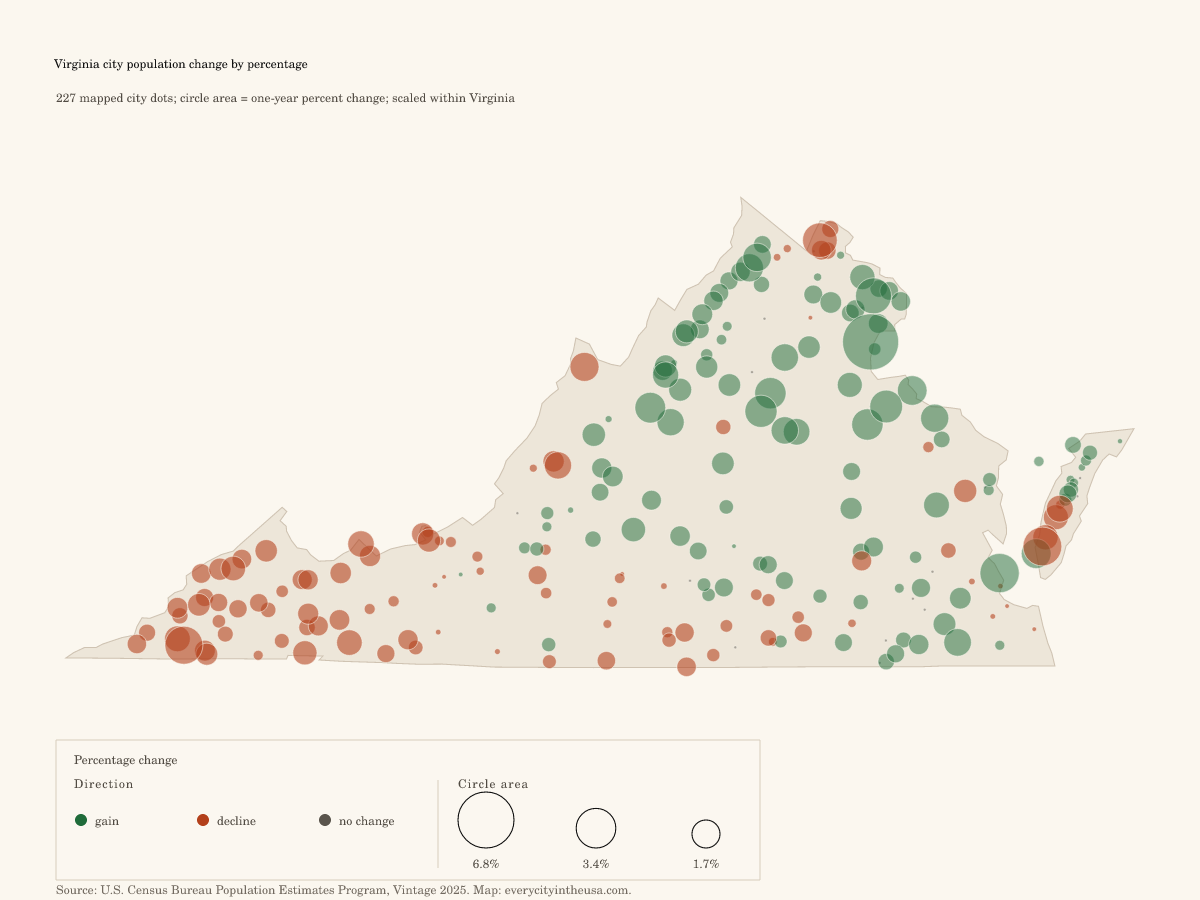
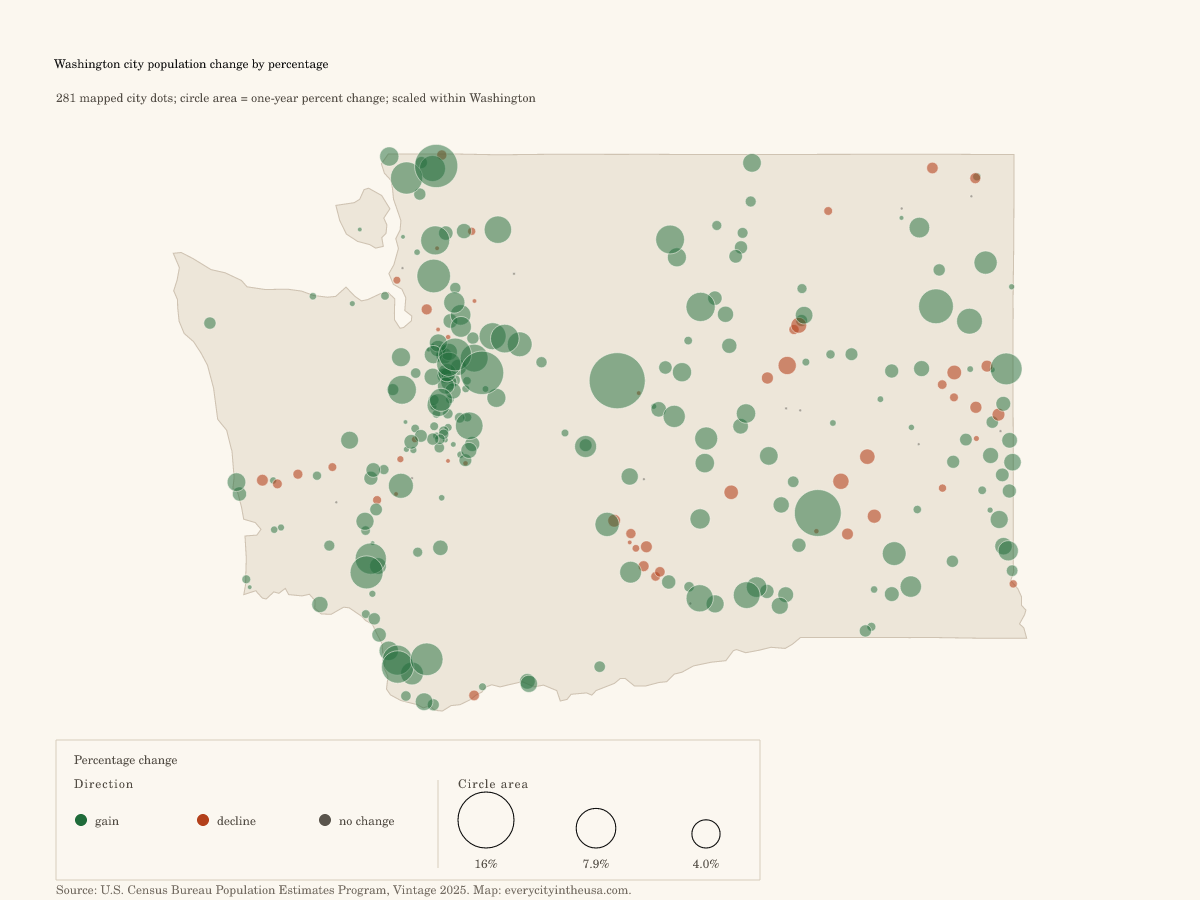
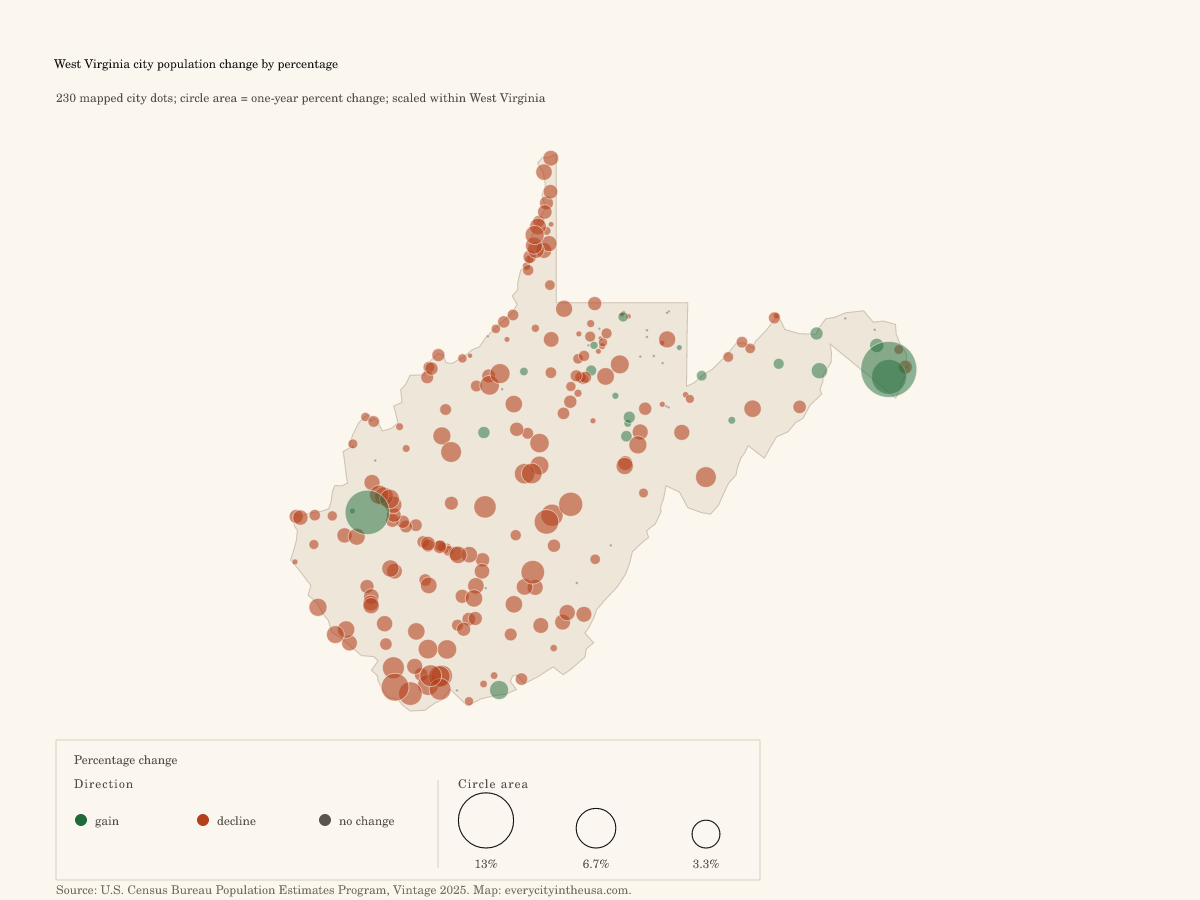
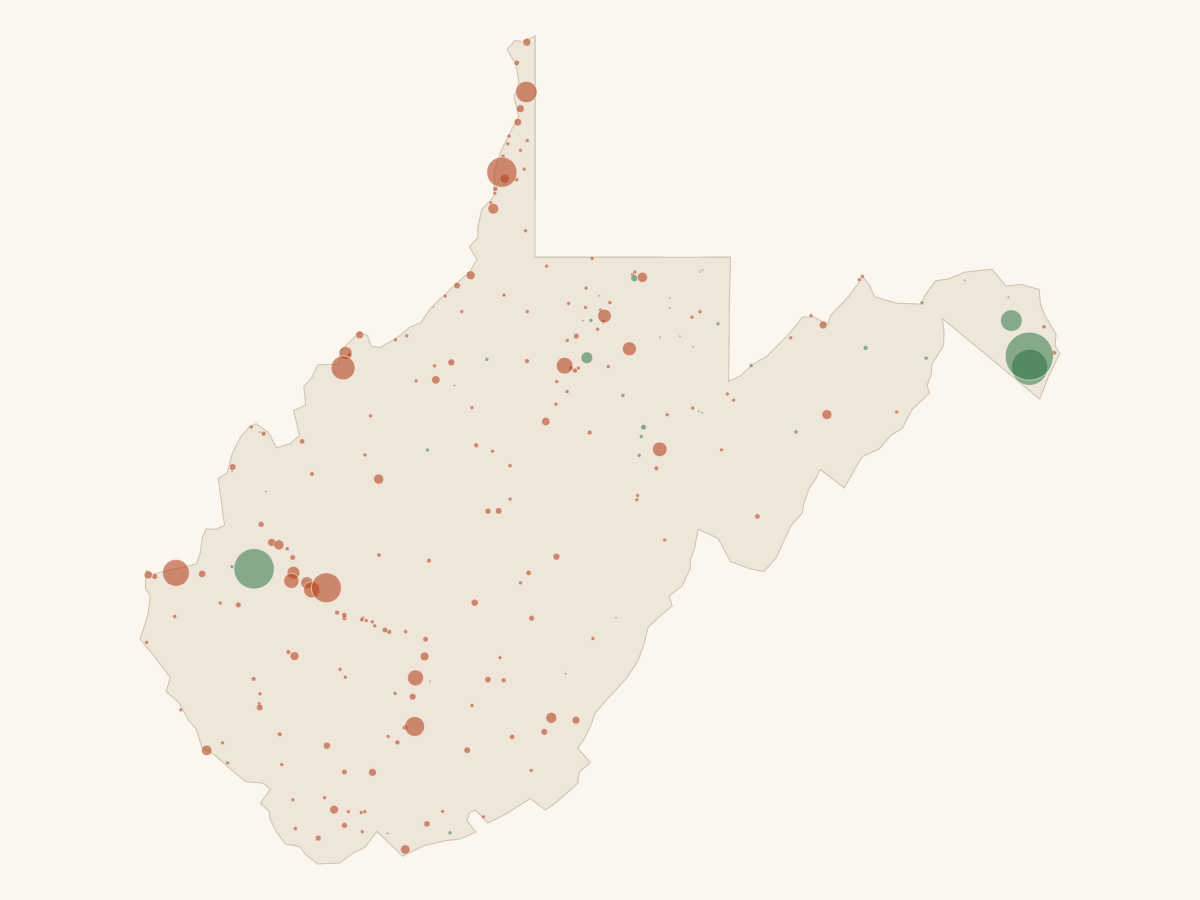
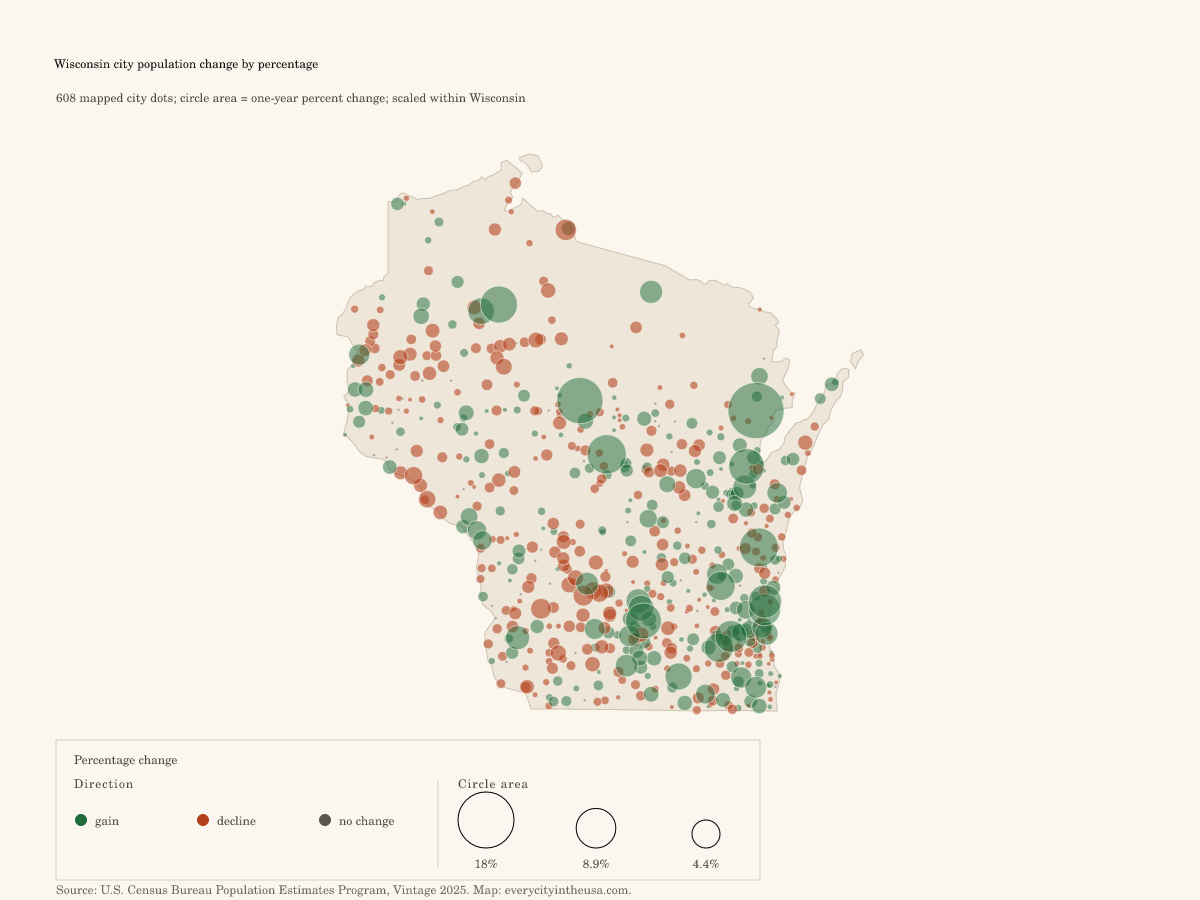
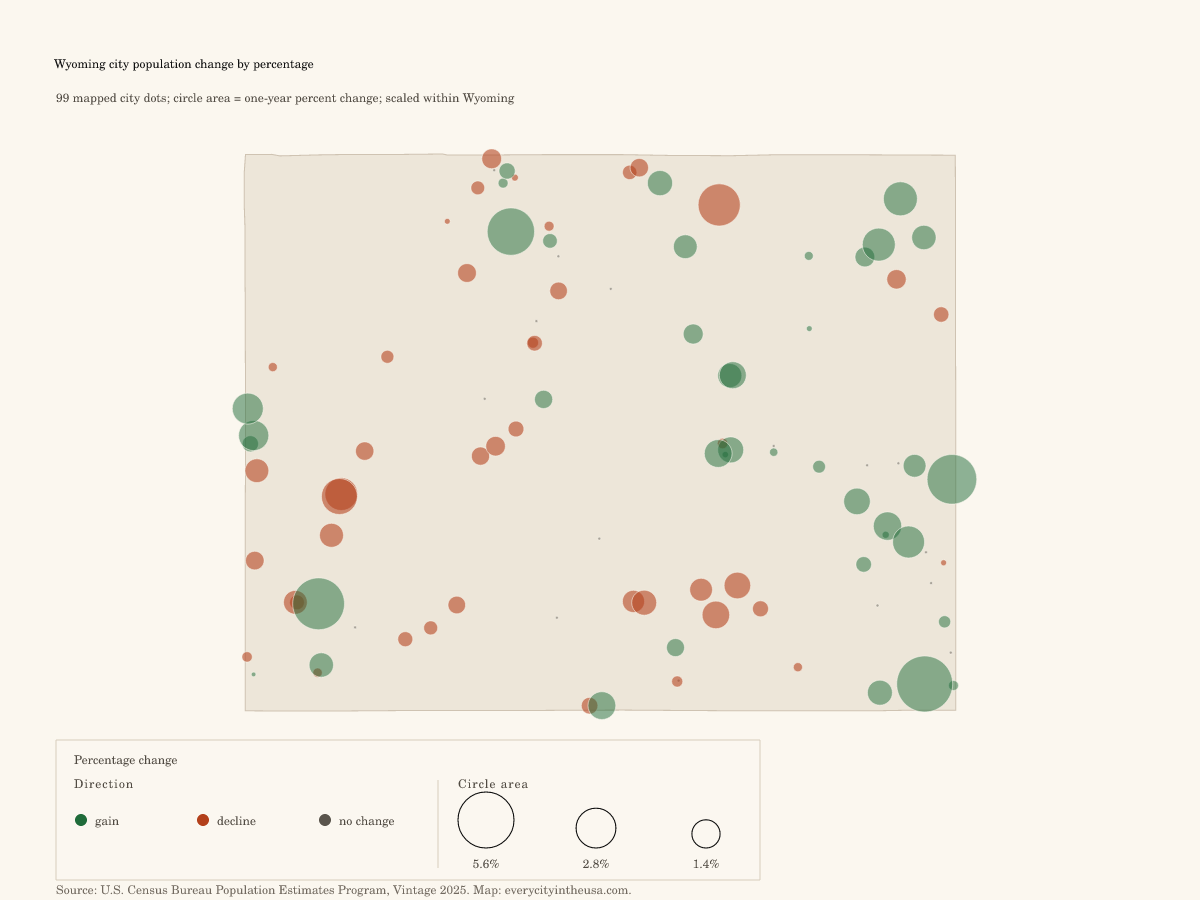
Where city populations changed fastest by percentage
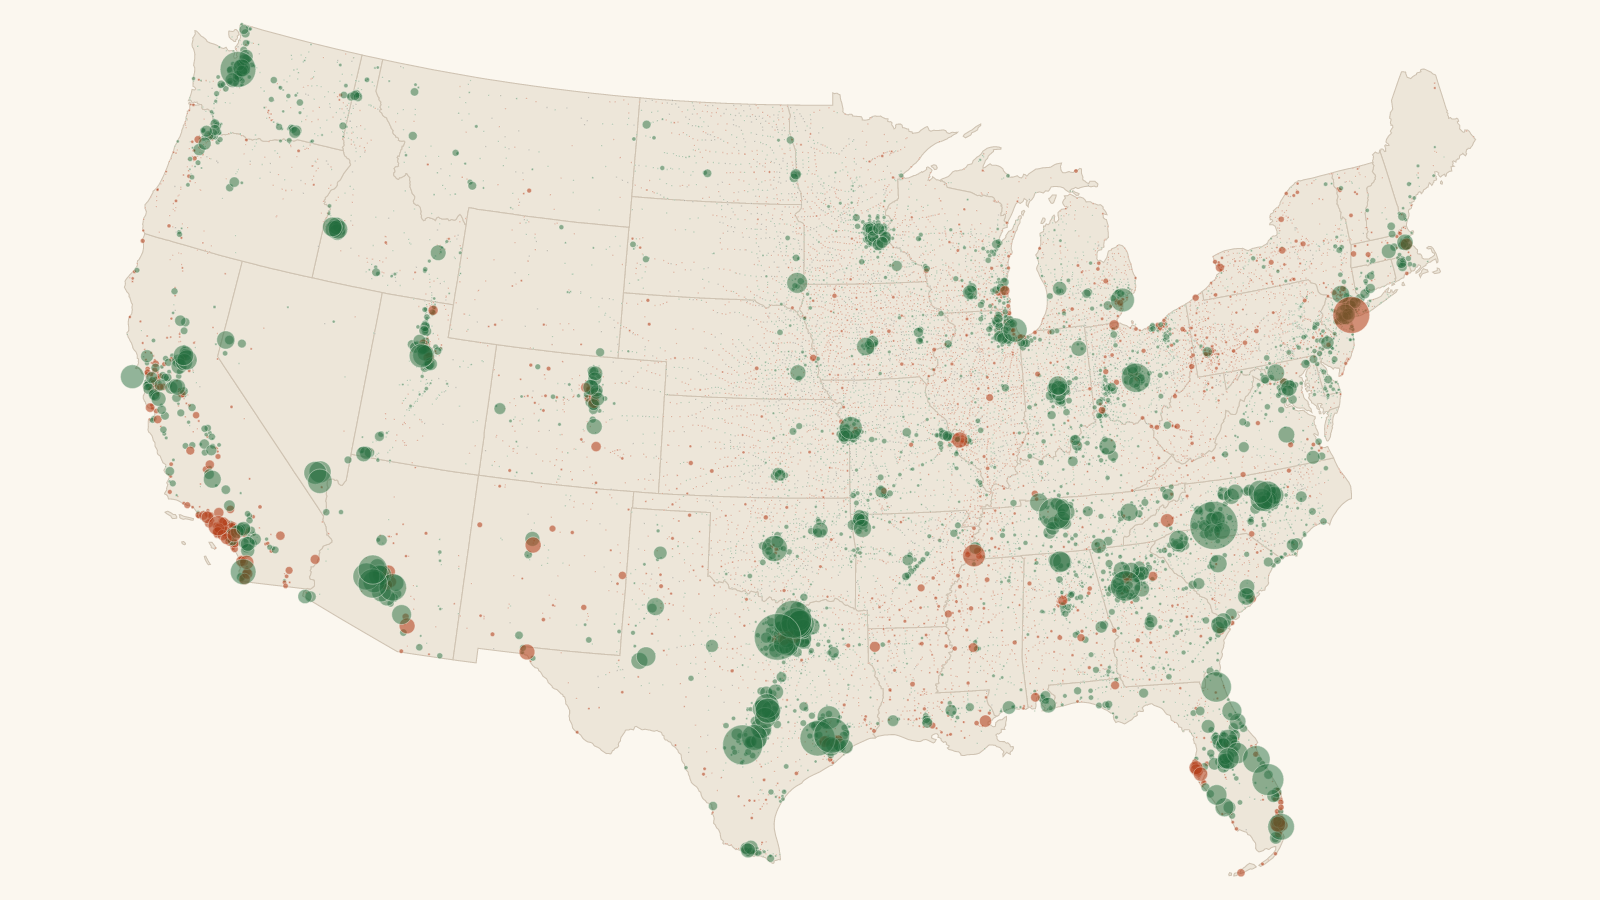
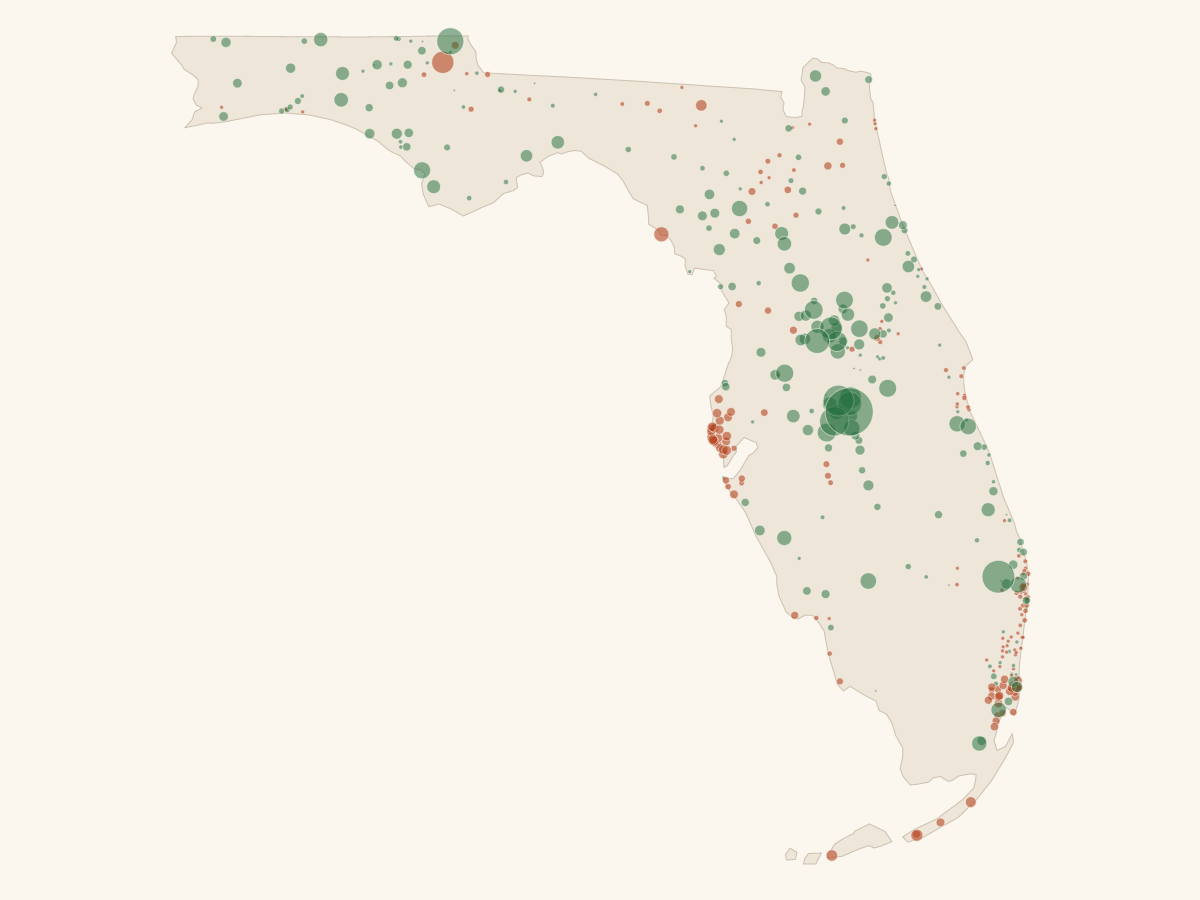
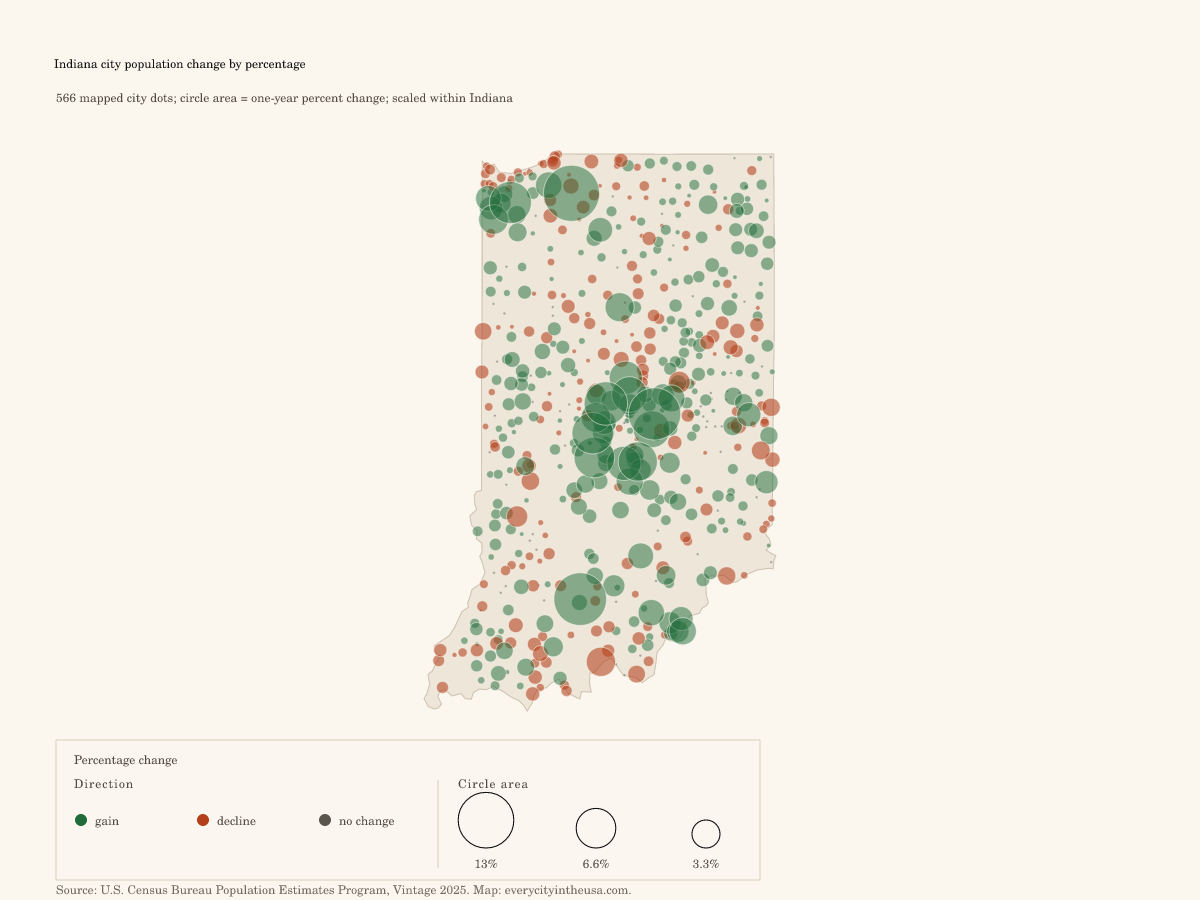
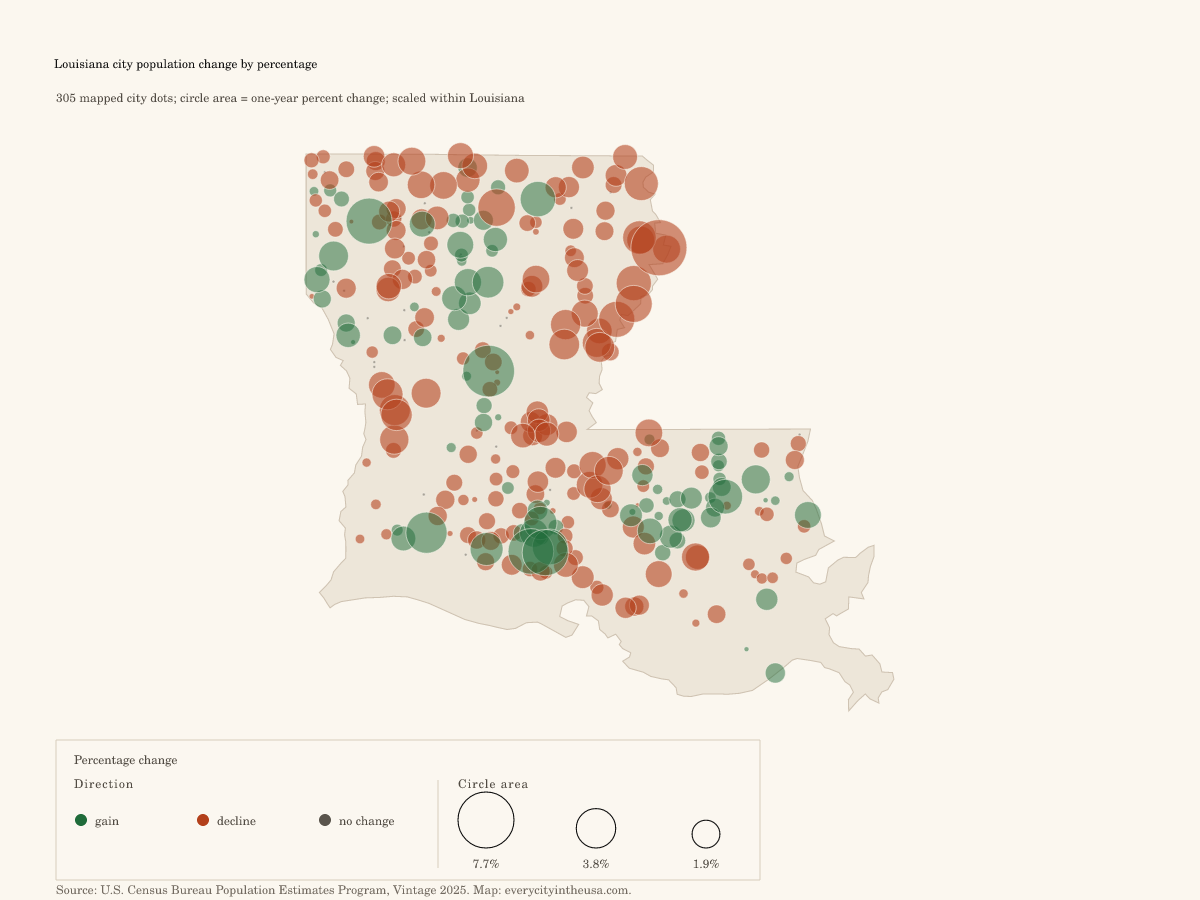
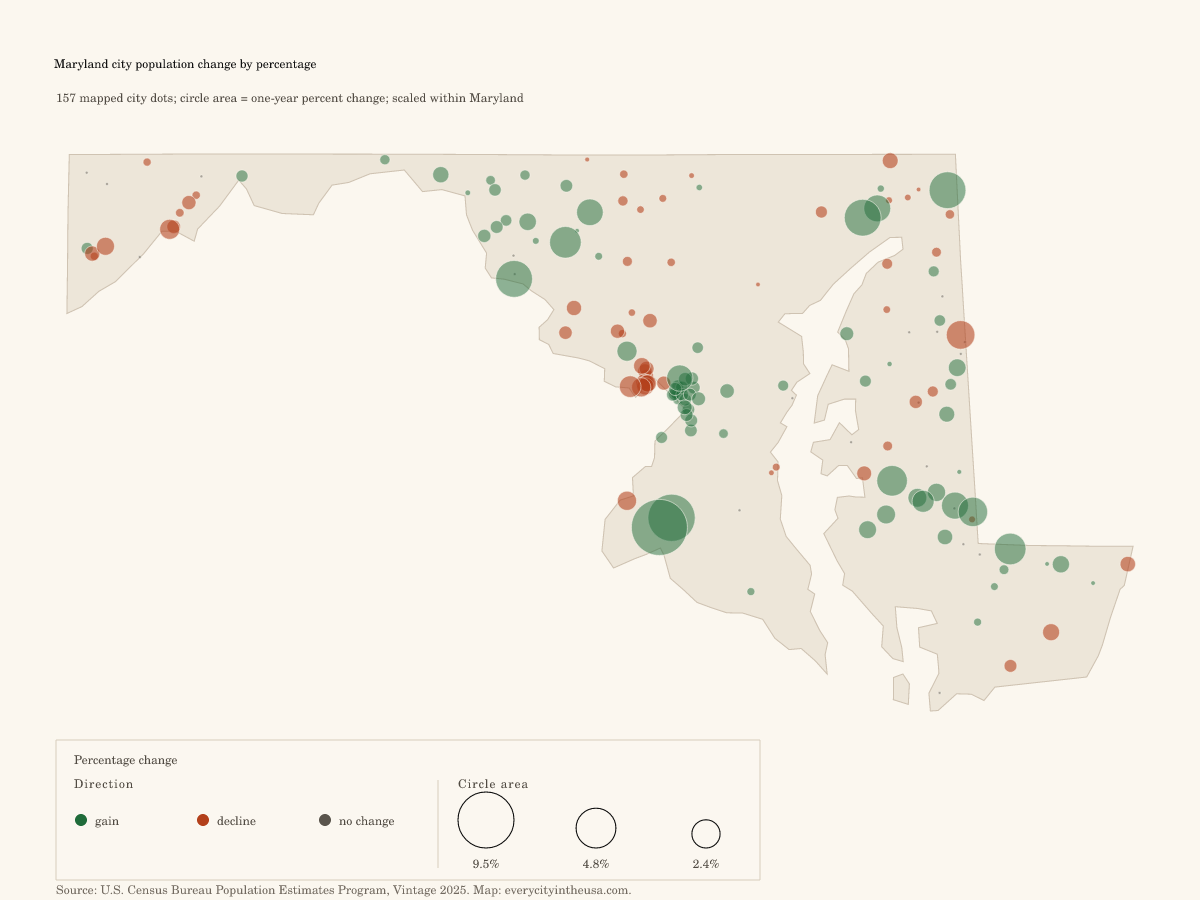
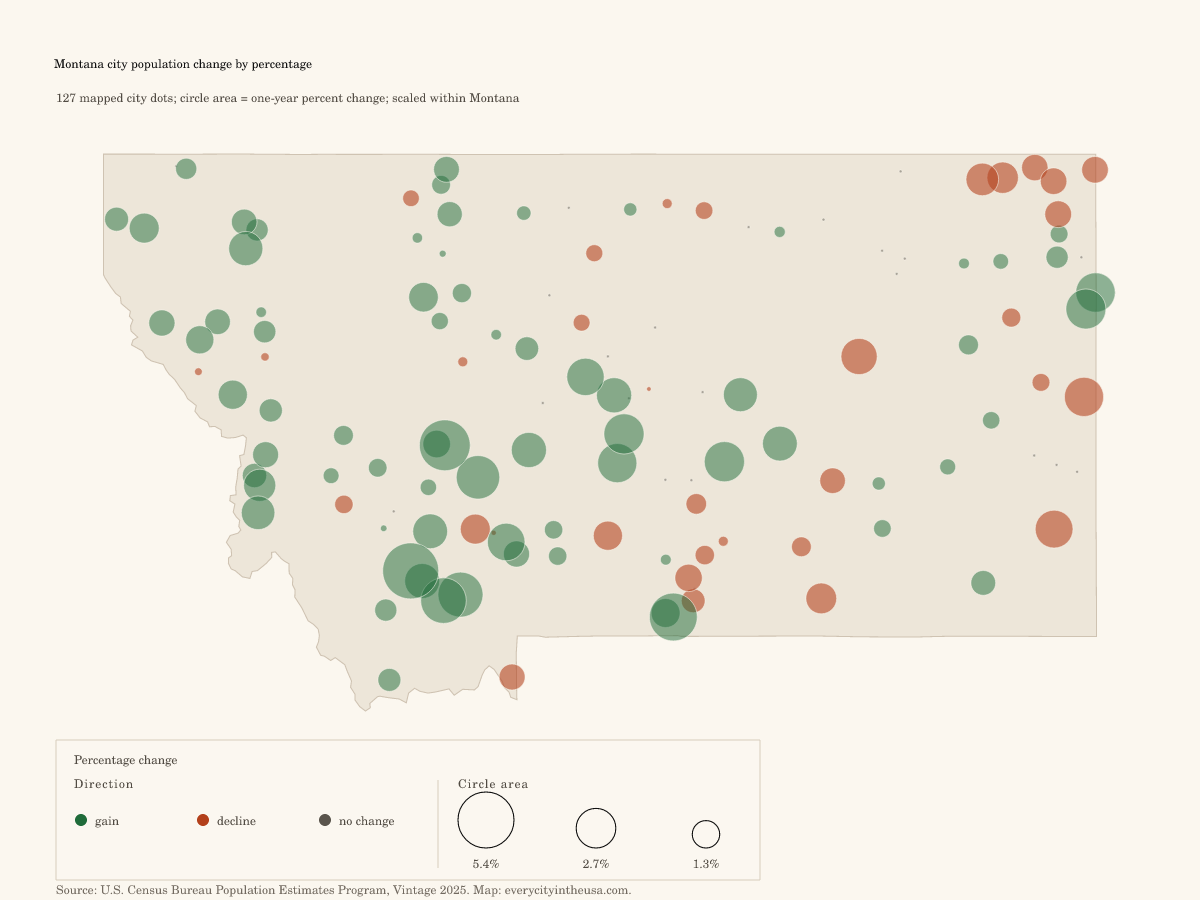
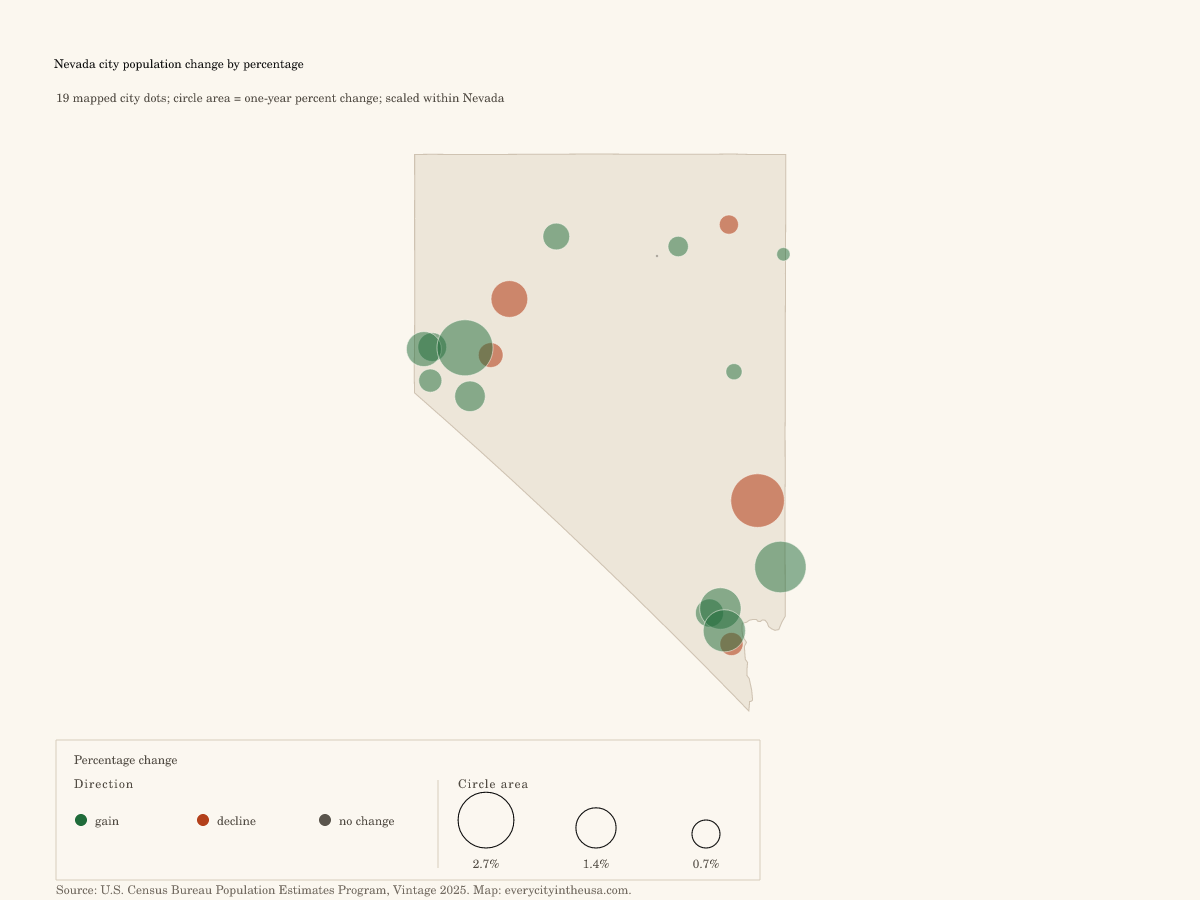
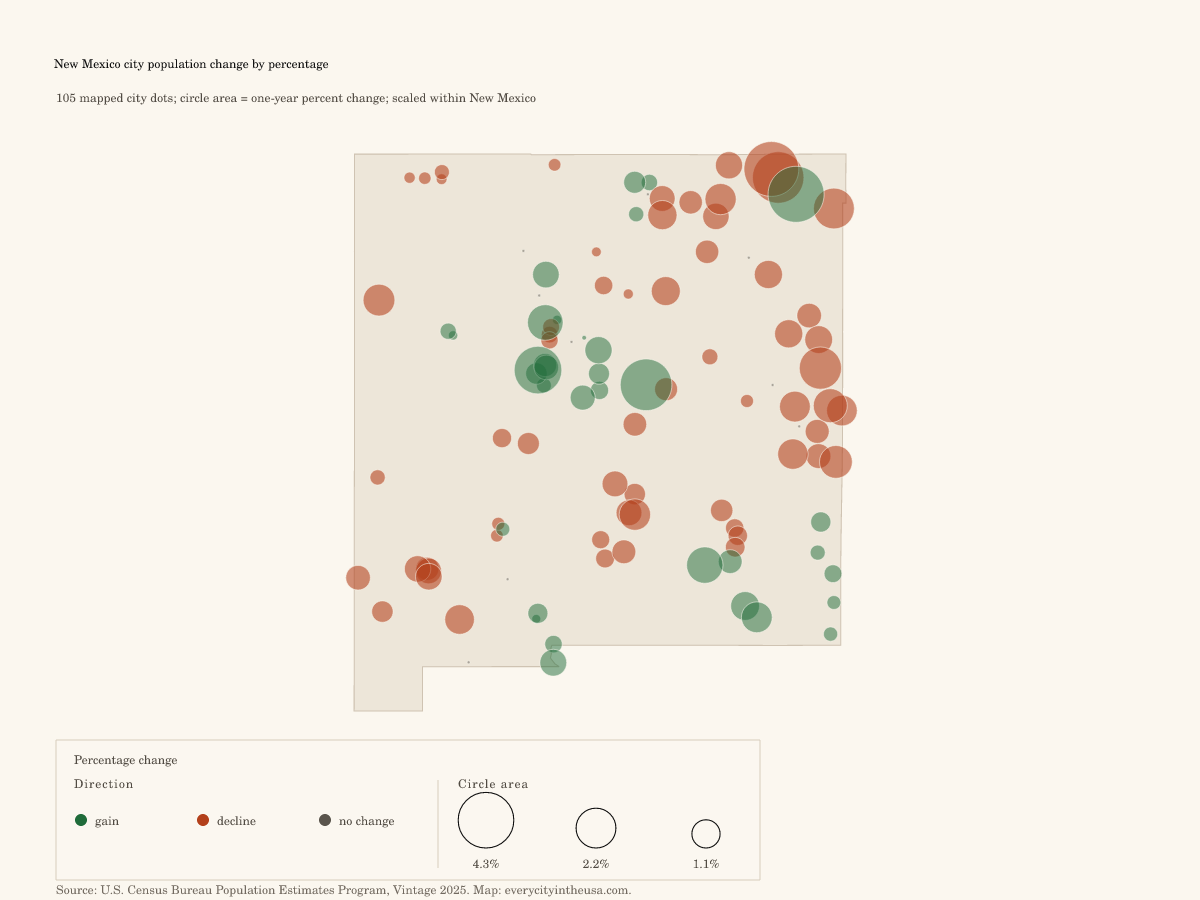
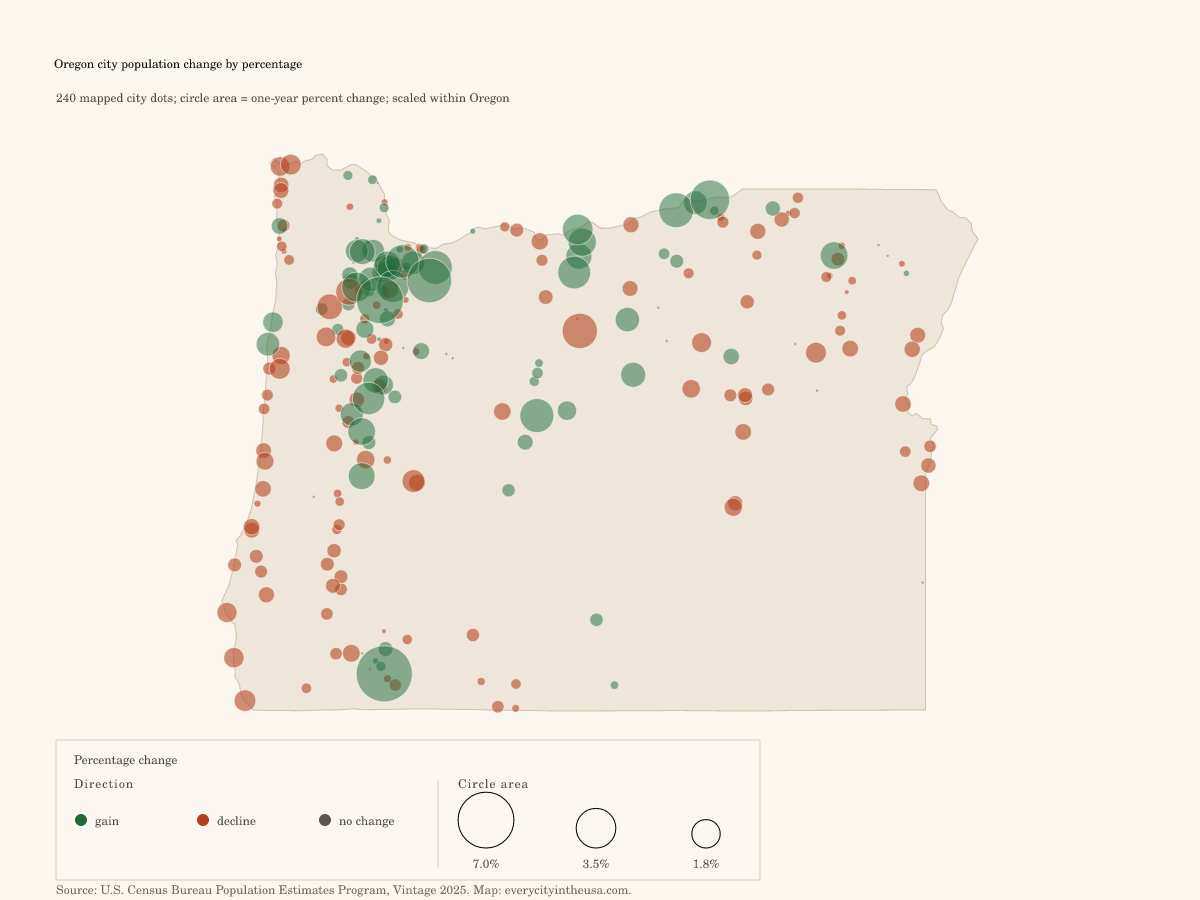
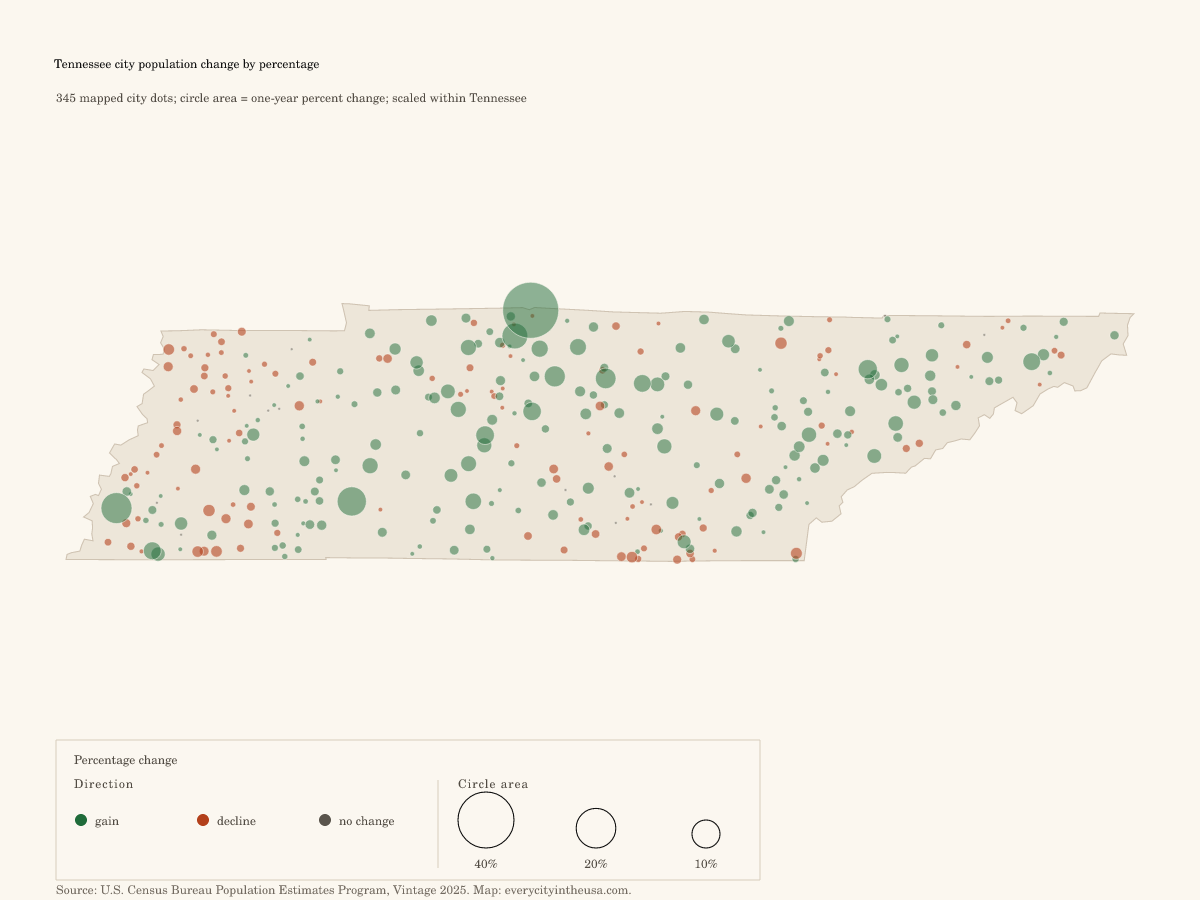
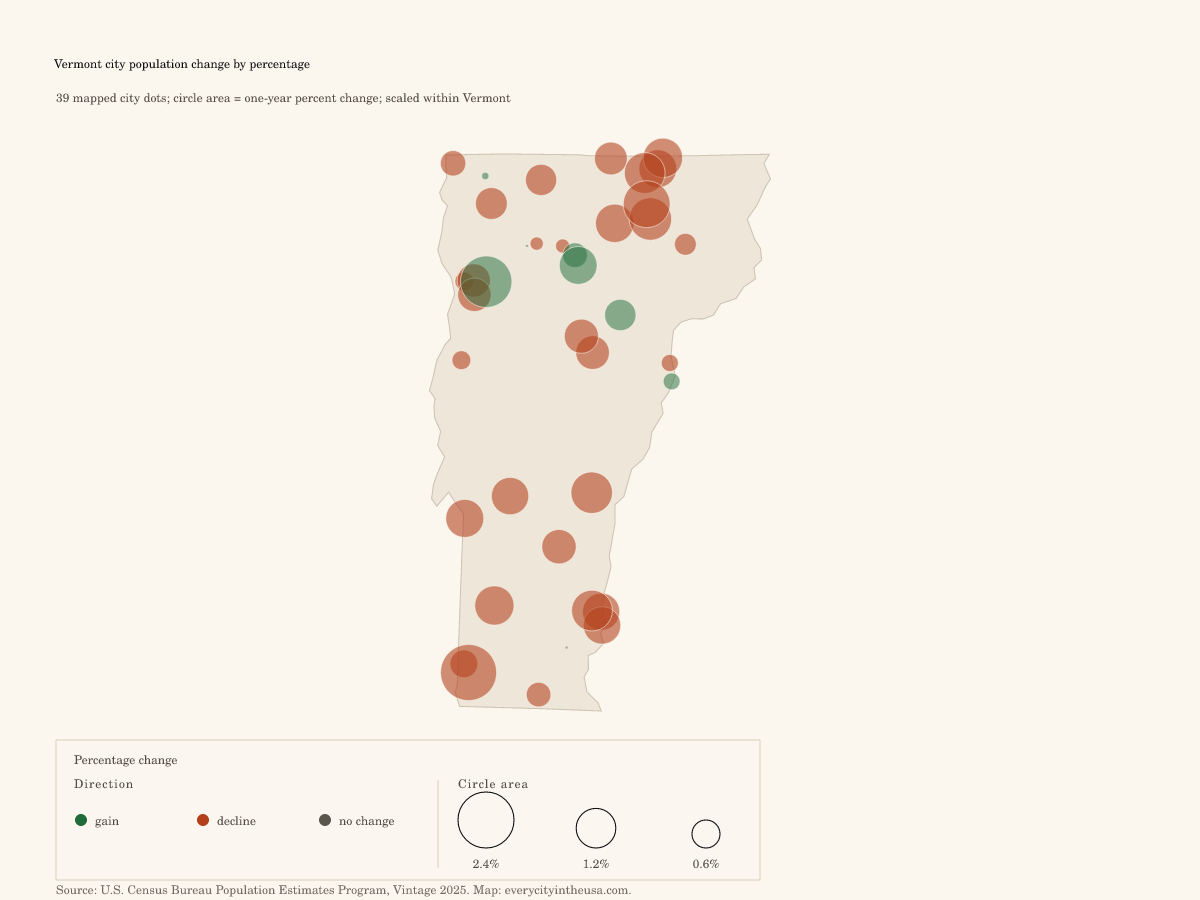
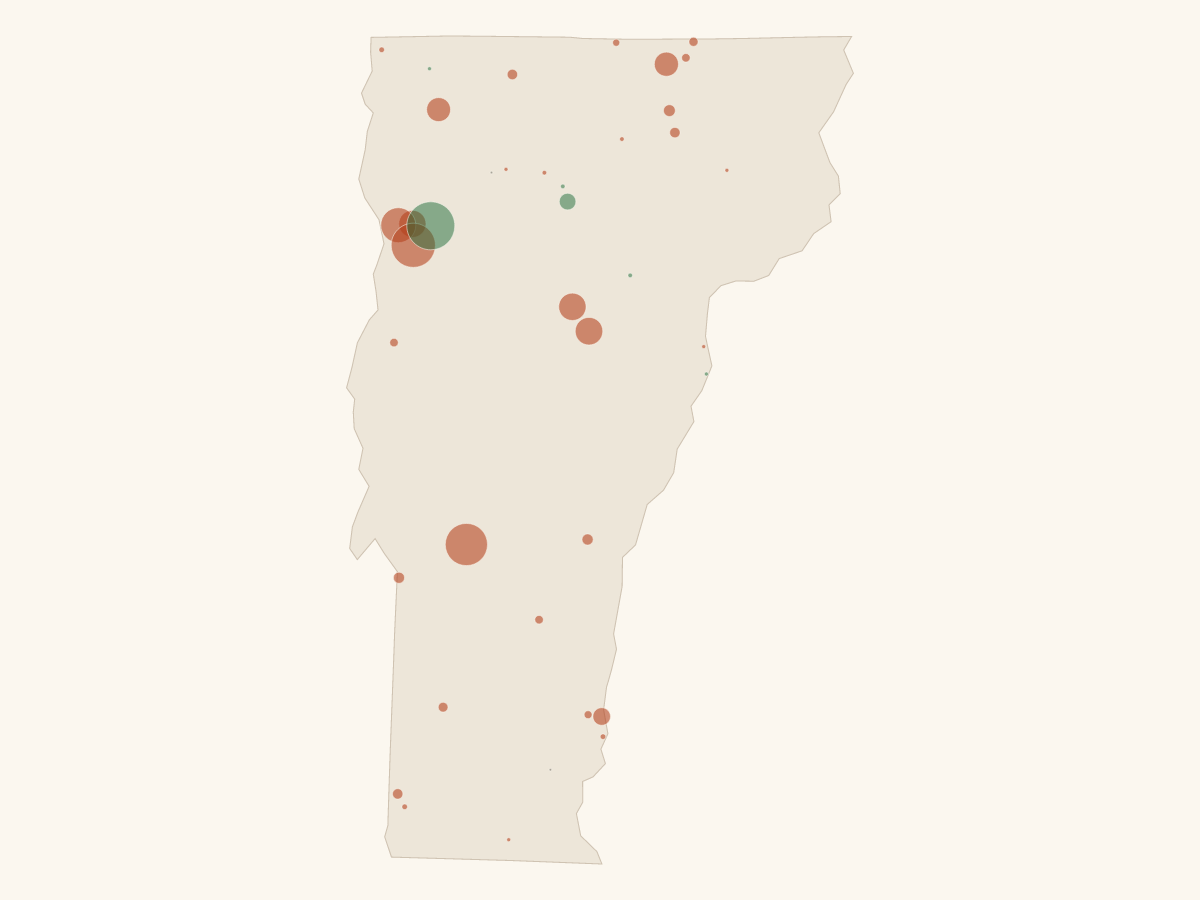
Featured map · circle area = percent change
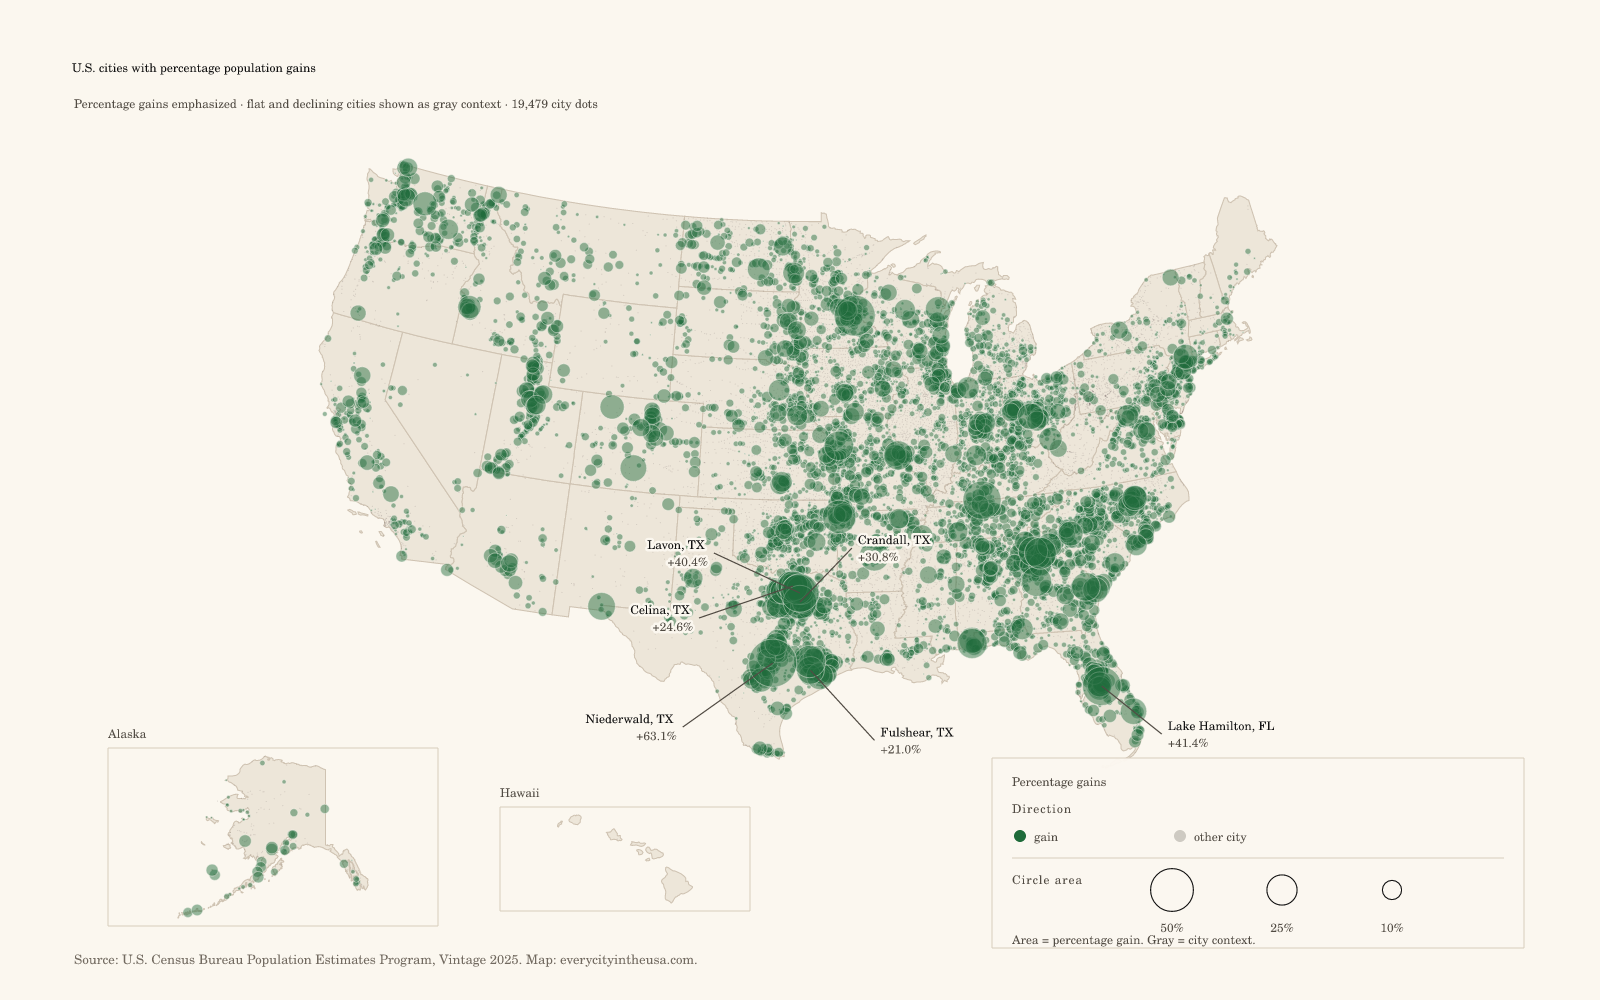
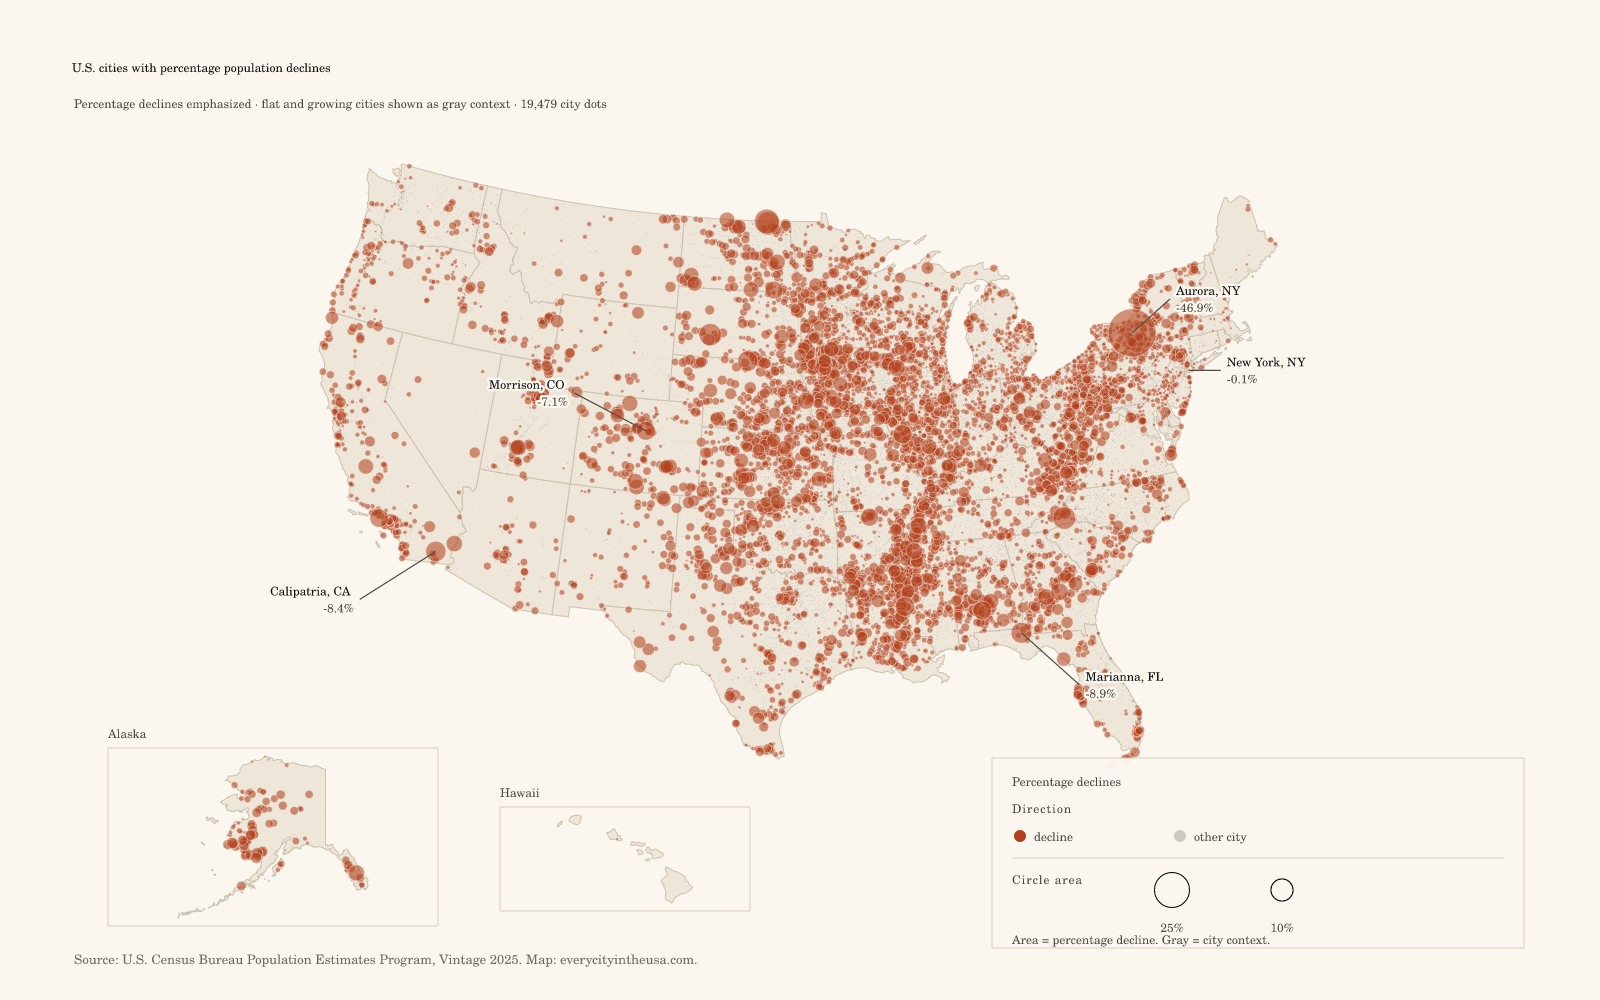
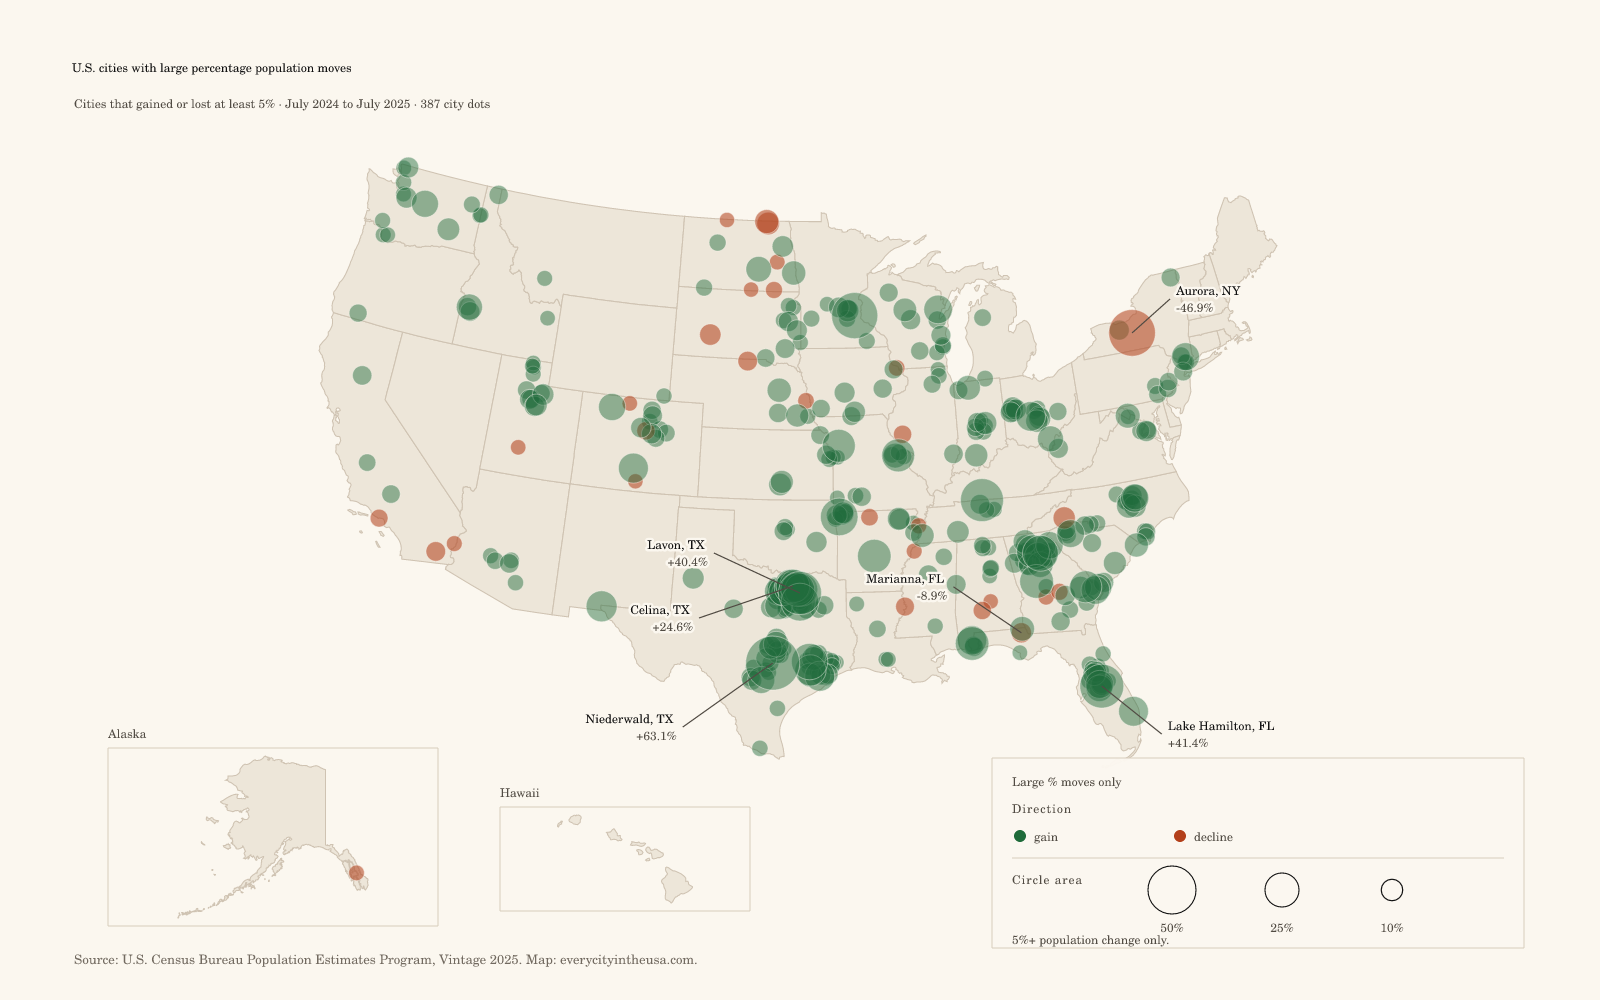
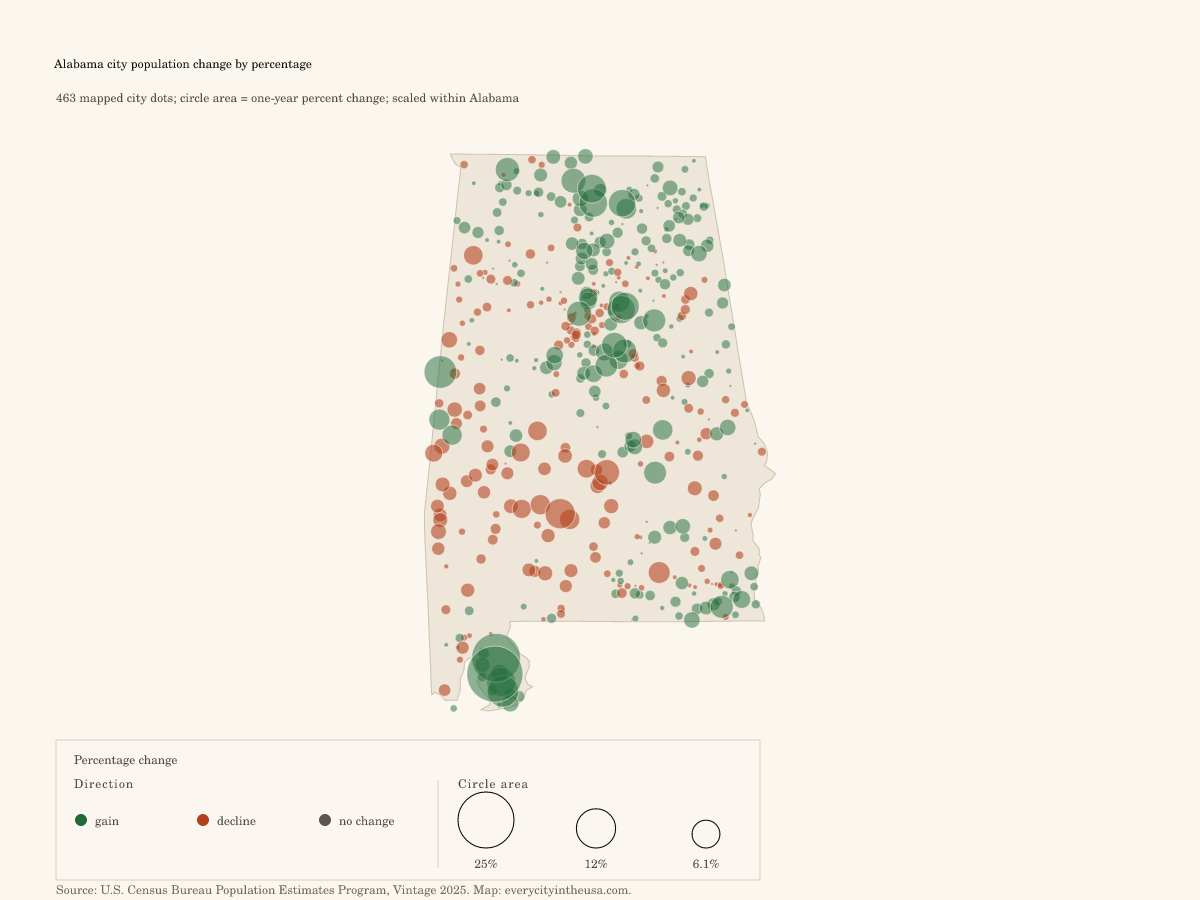
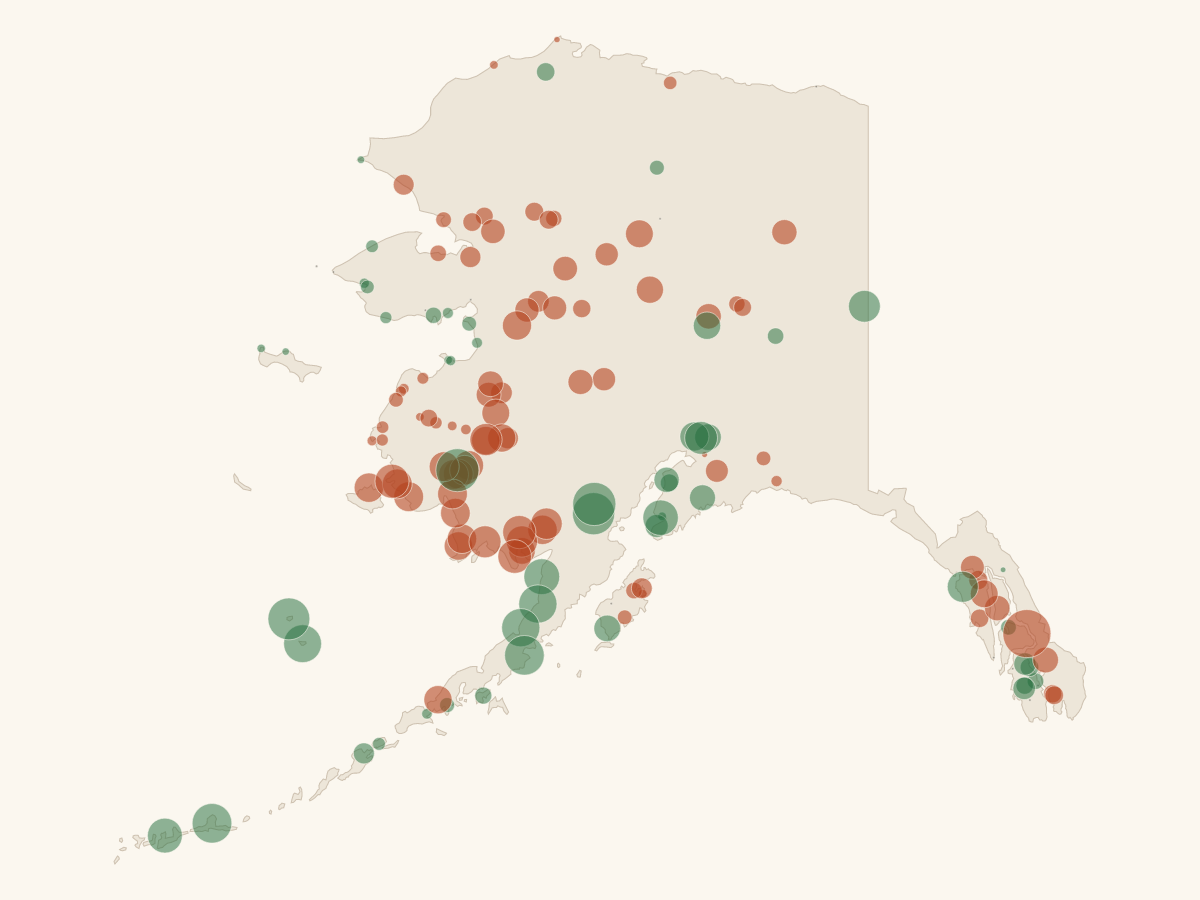
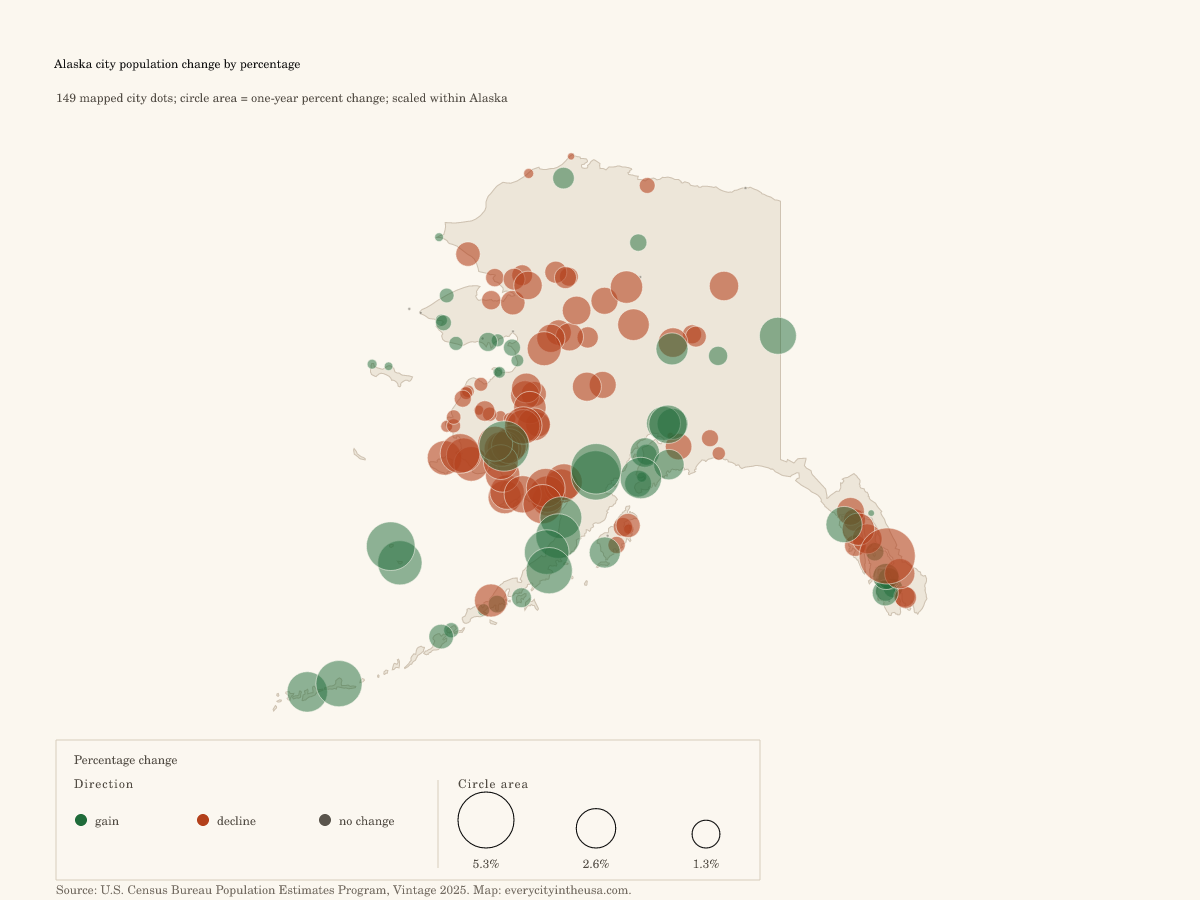
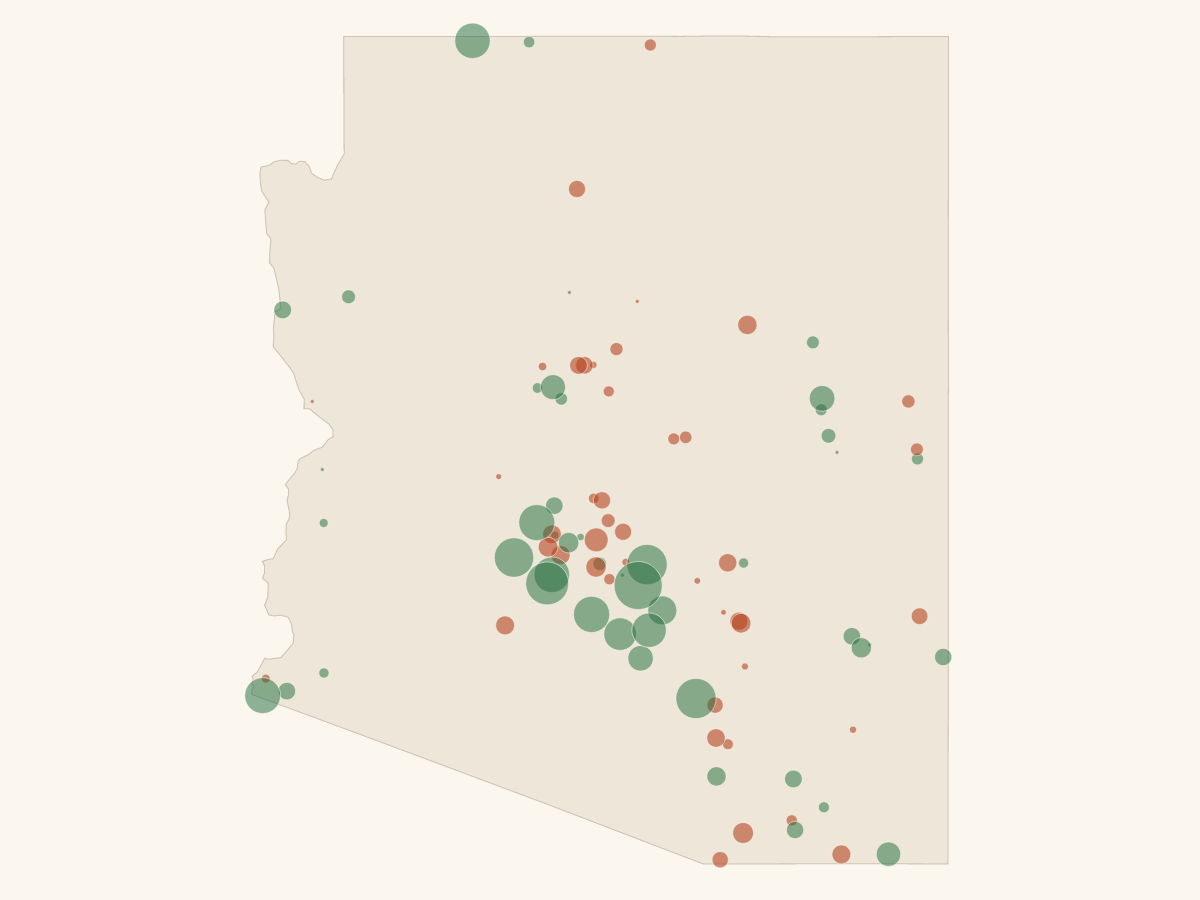
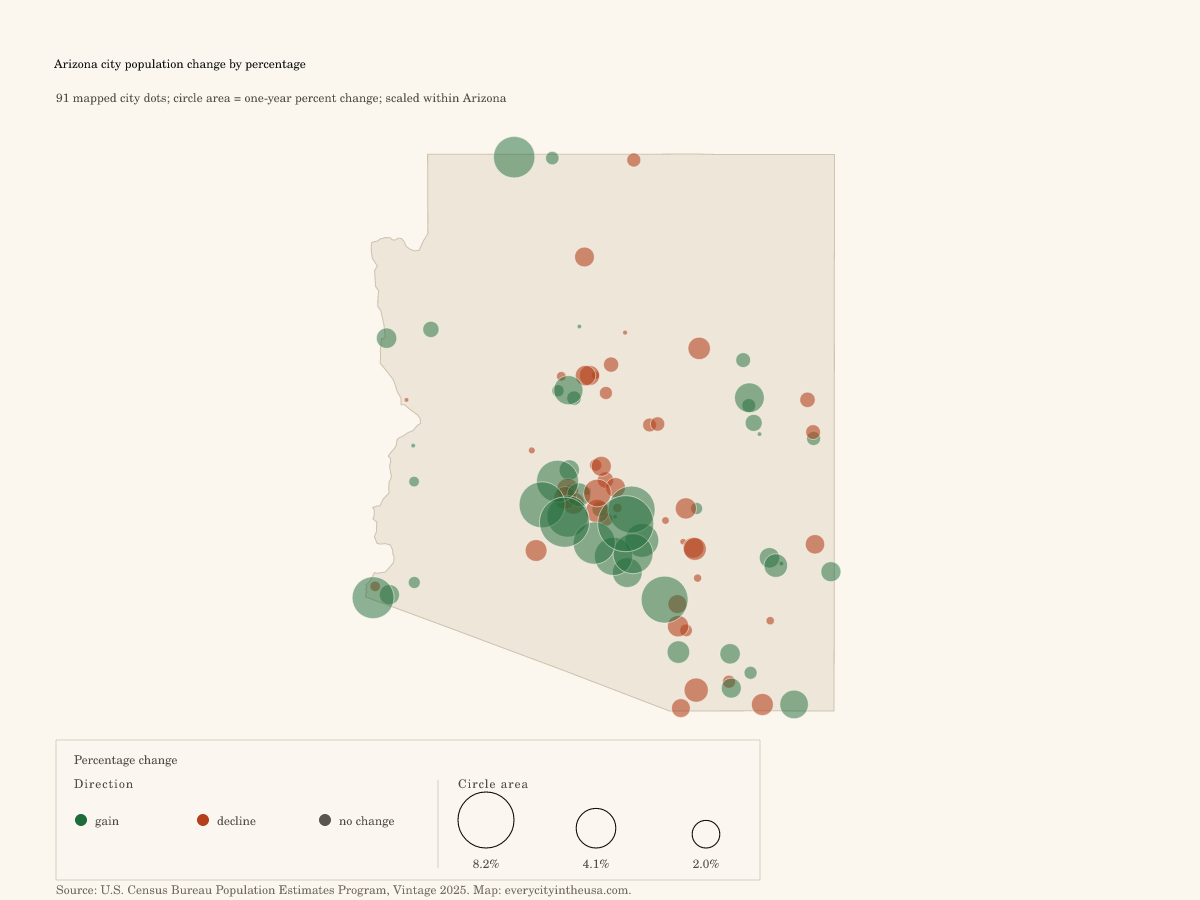
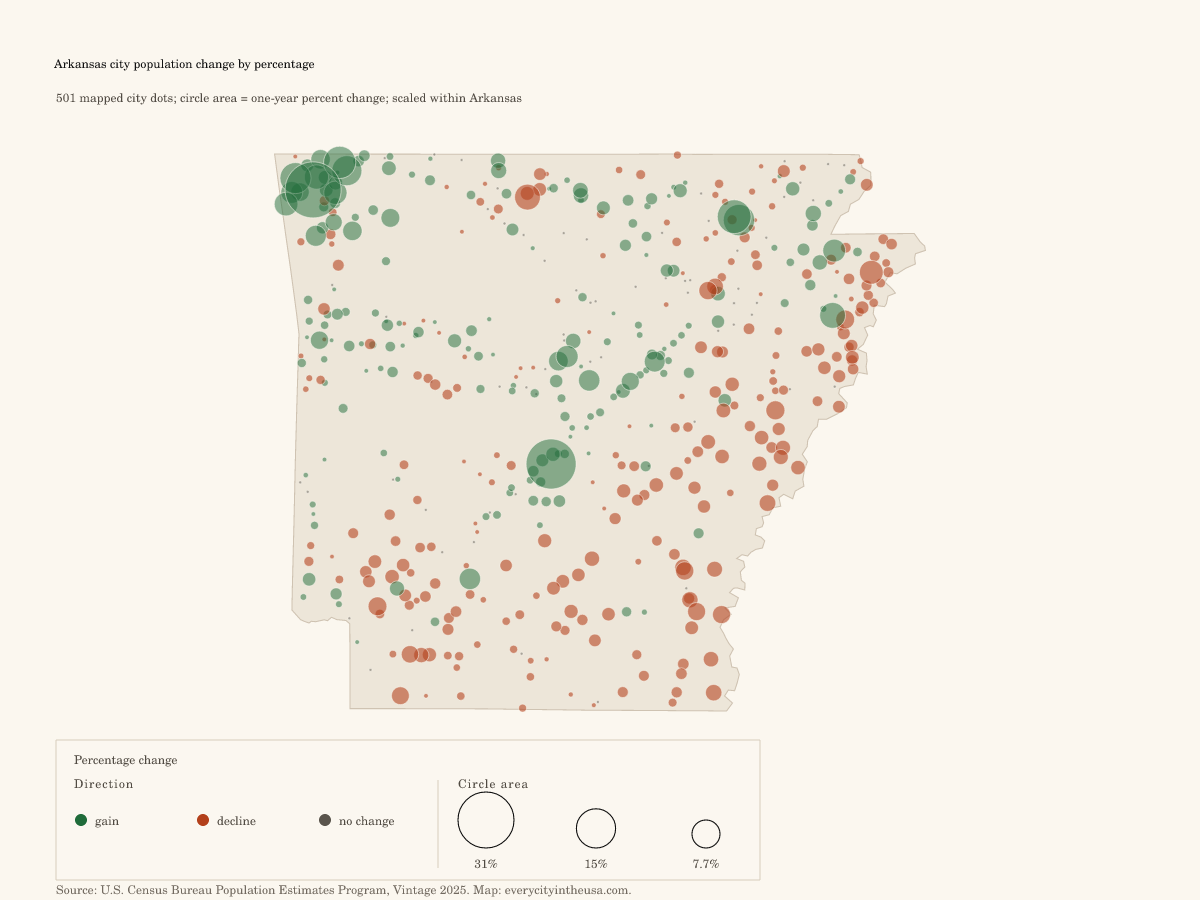
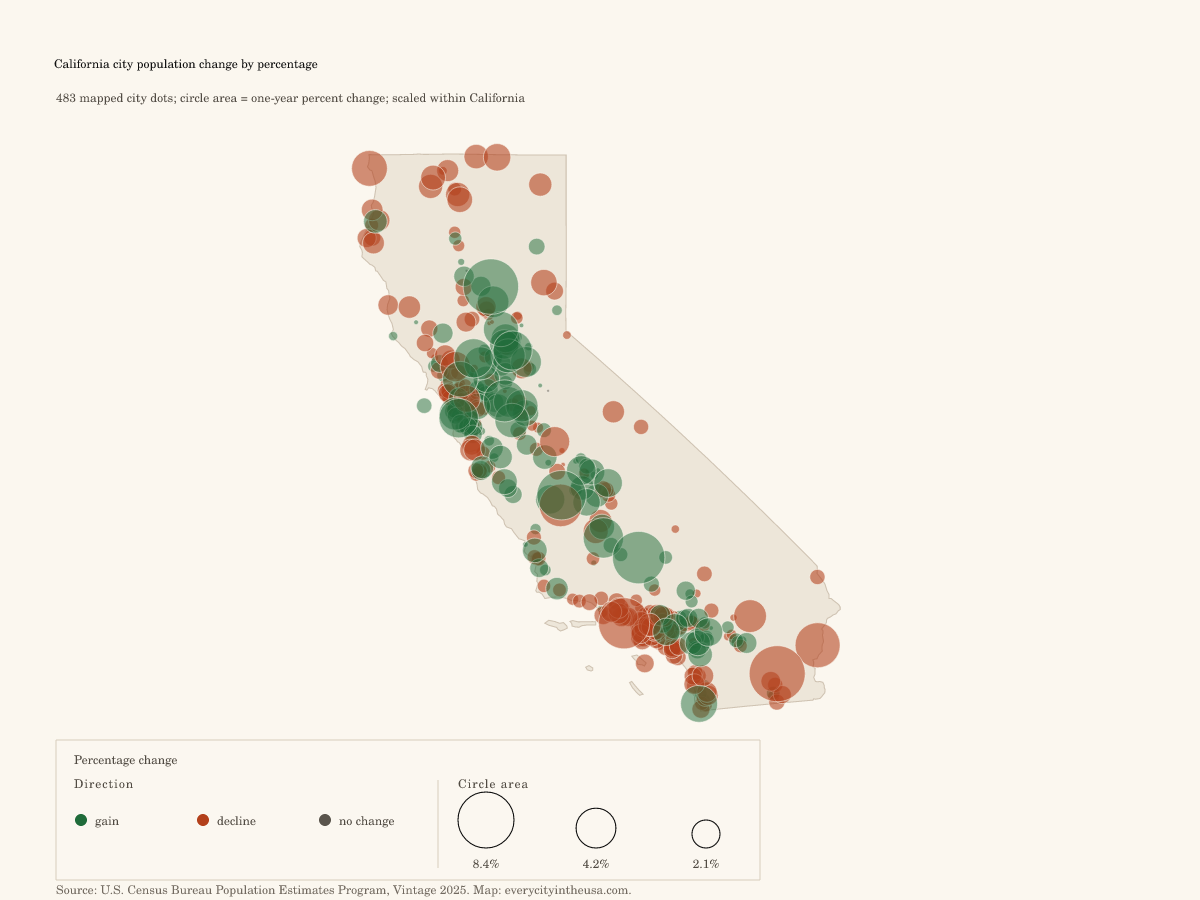
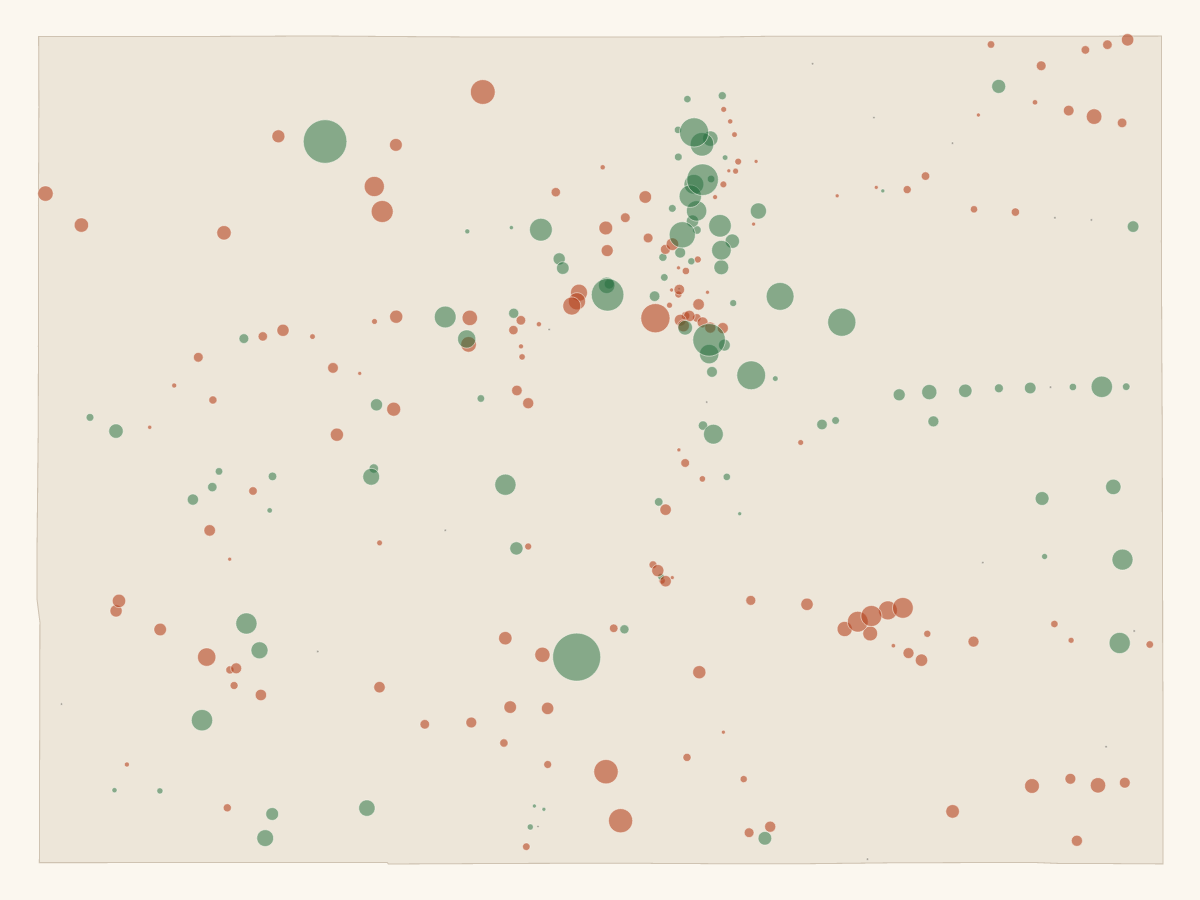
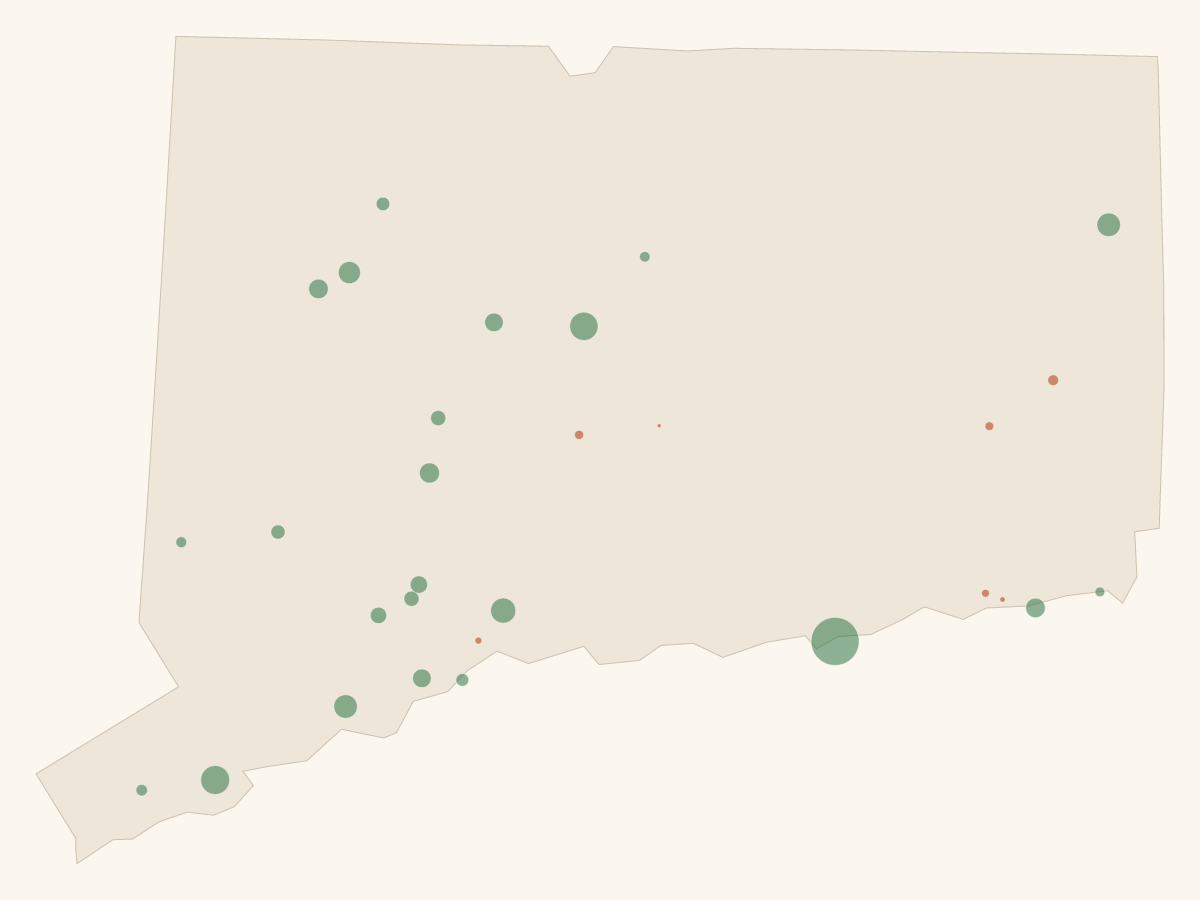
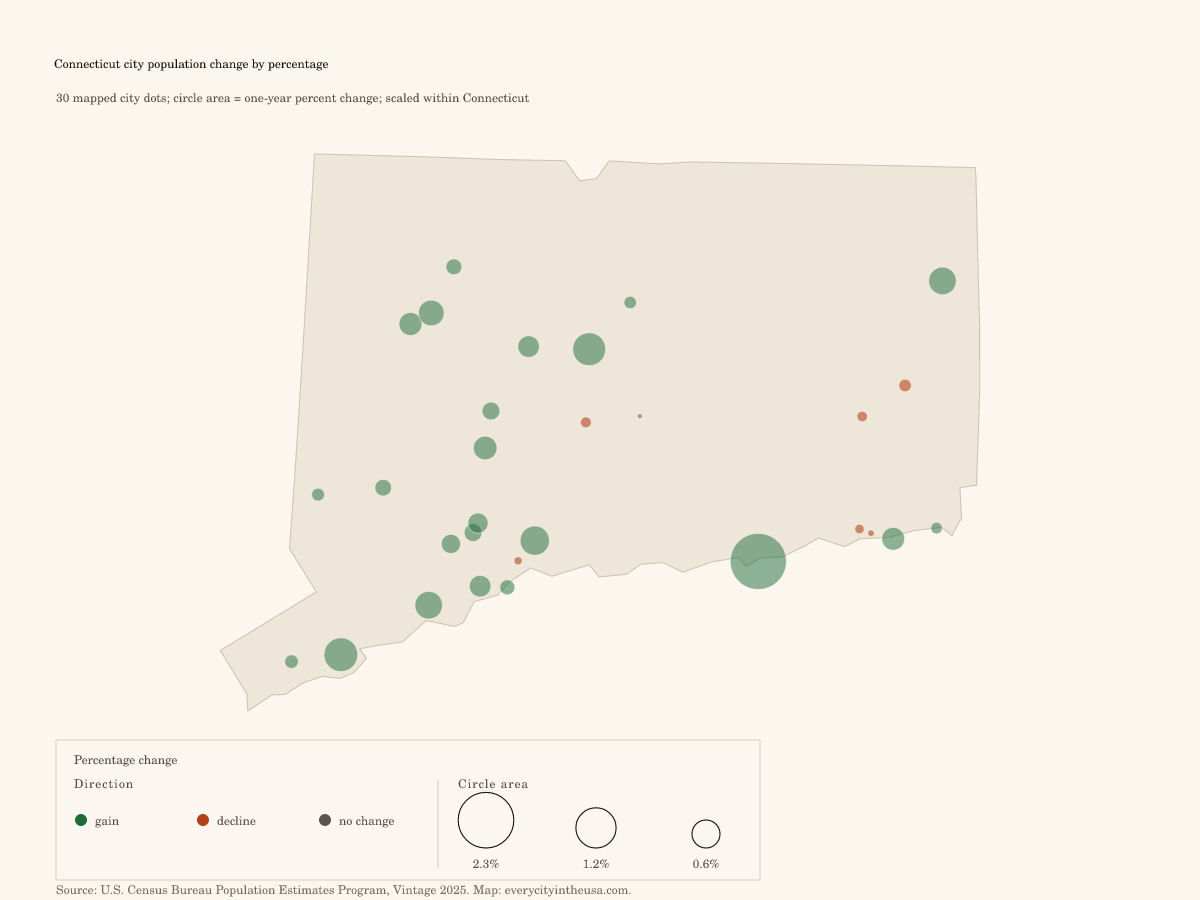
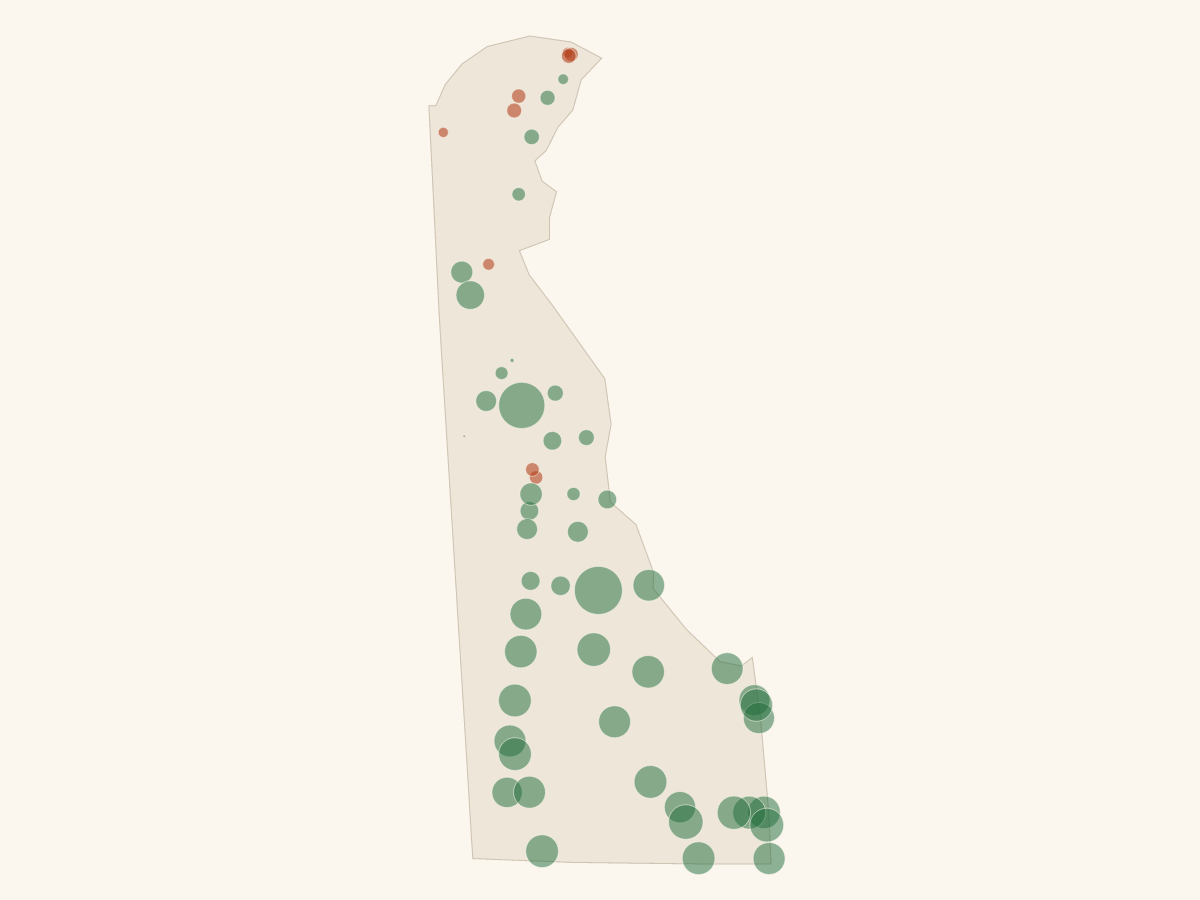
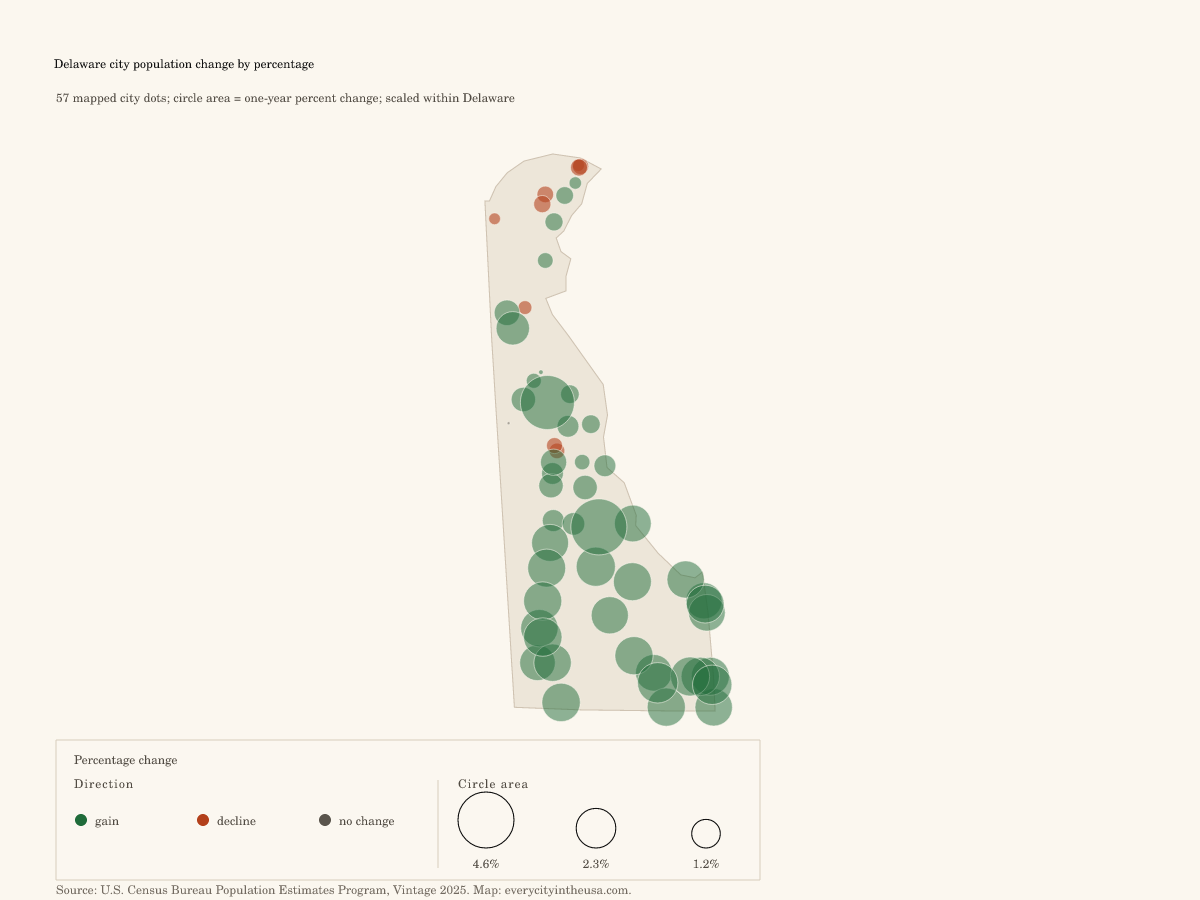
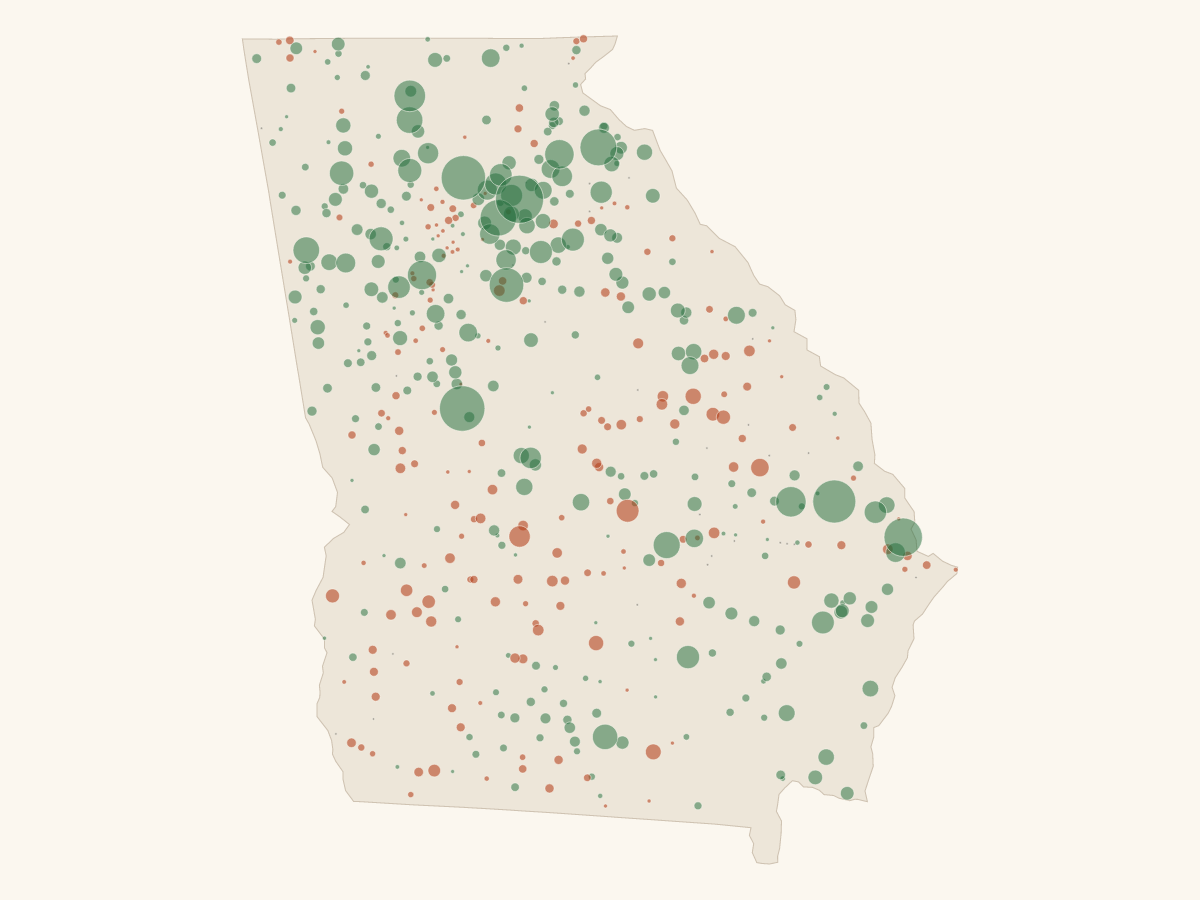
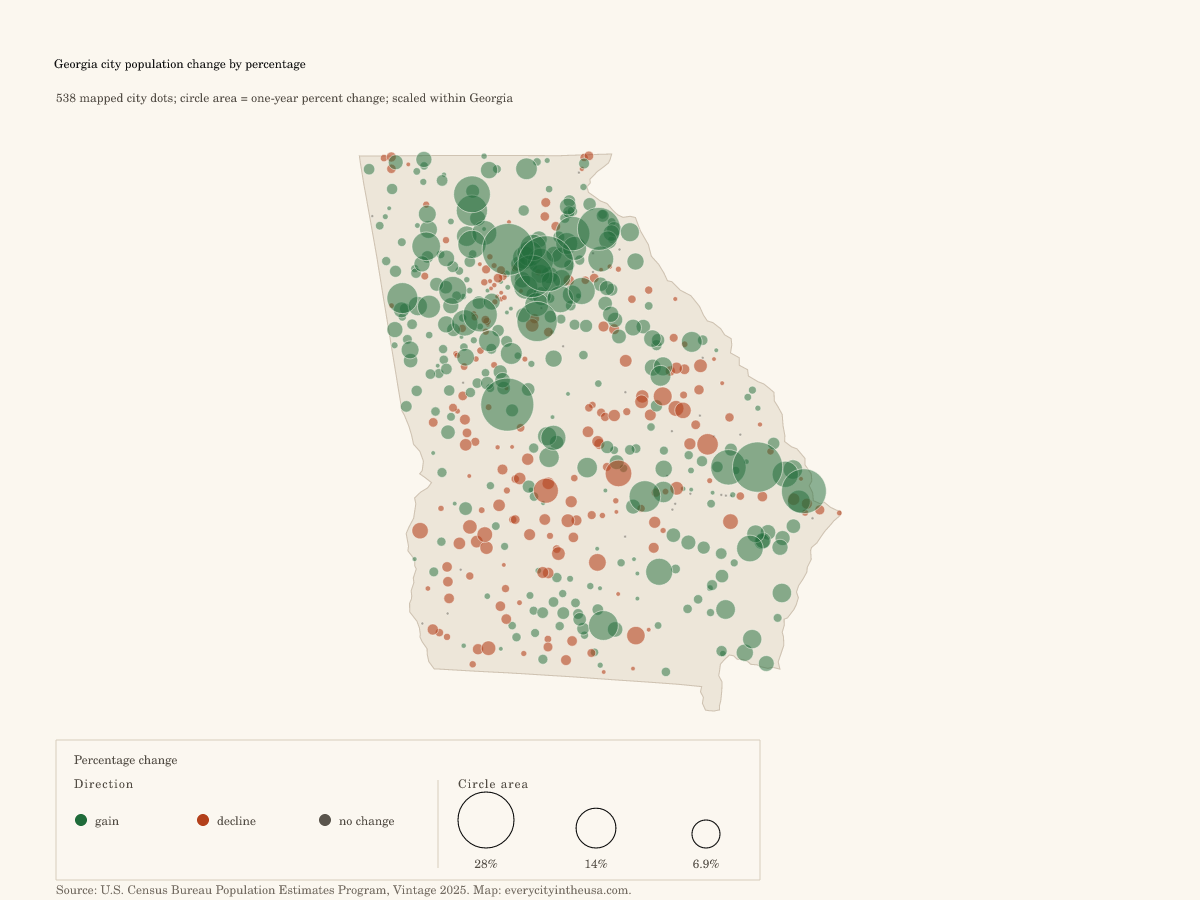
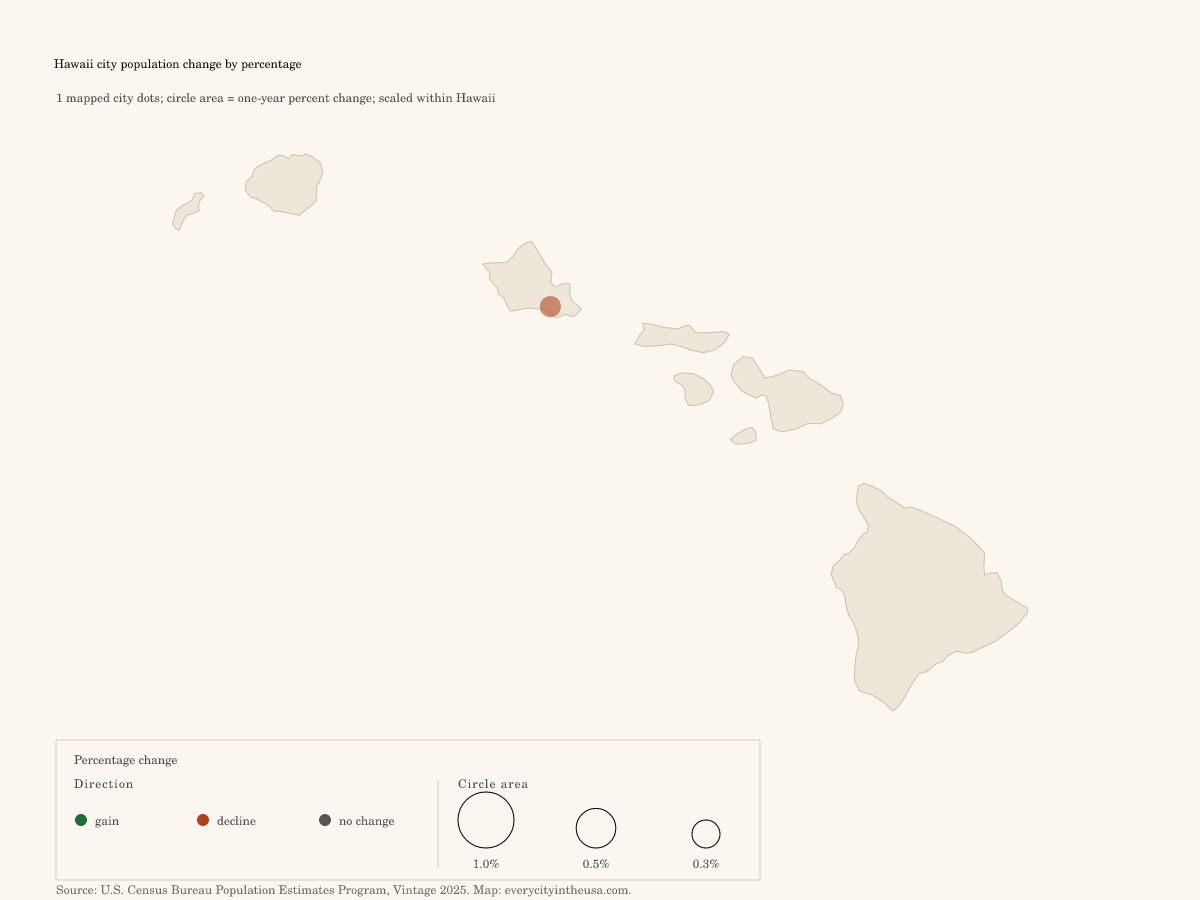
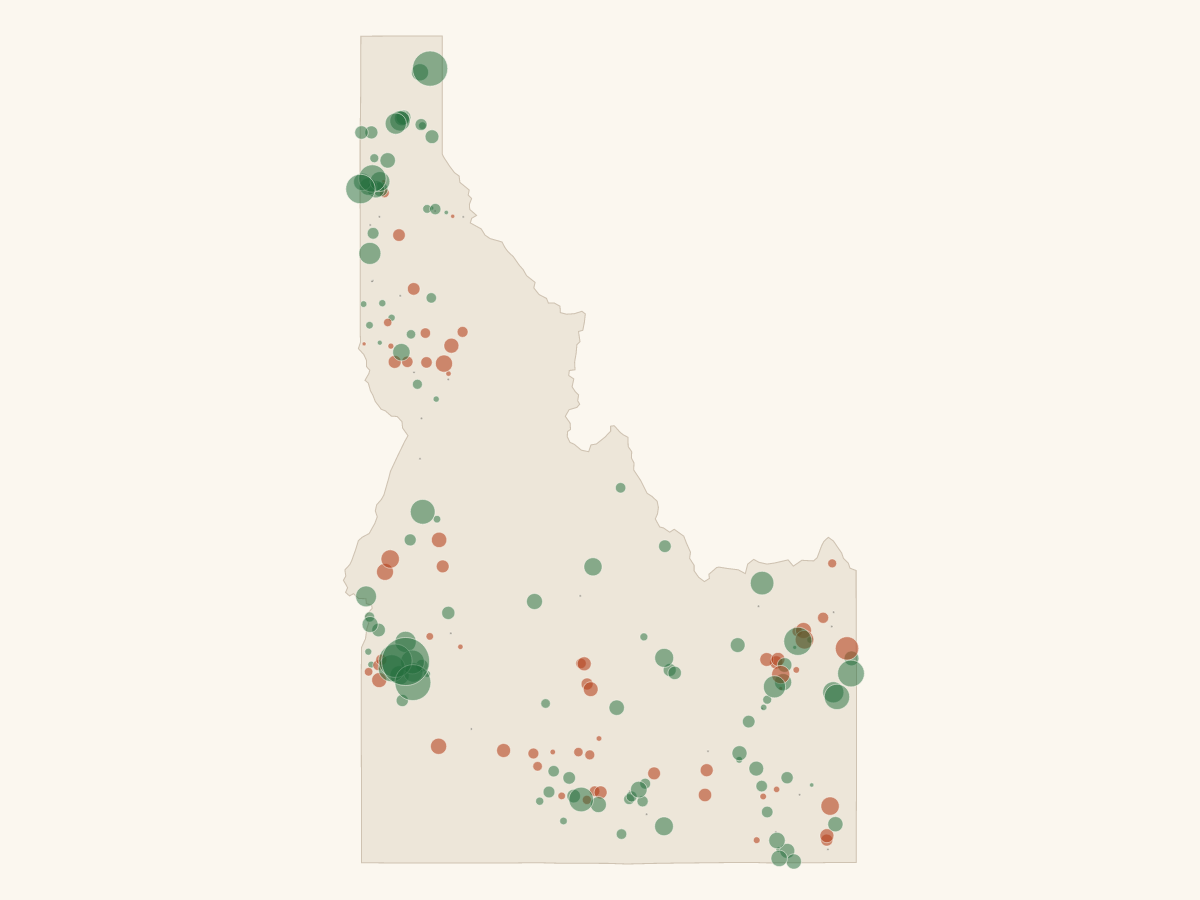
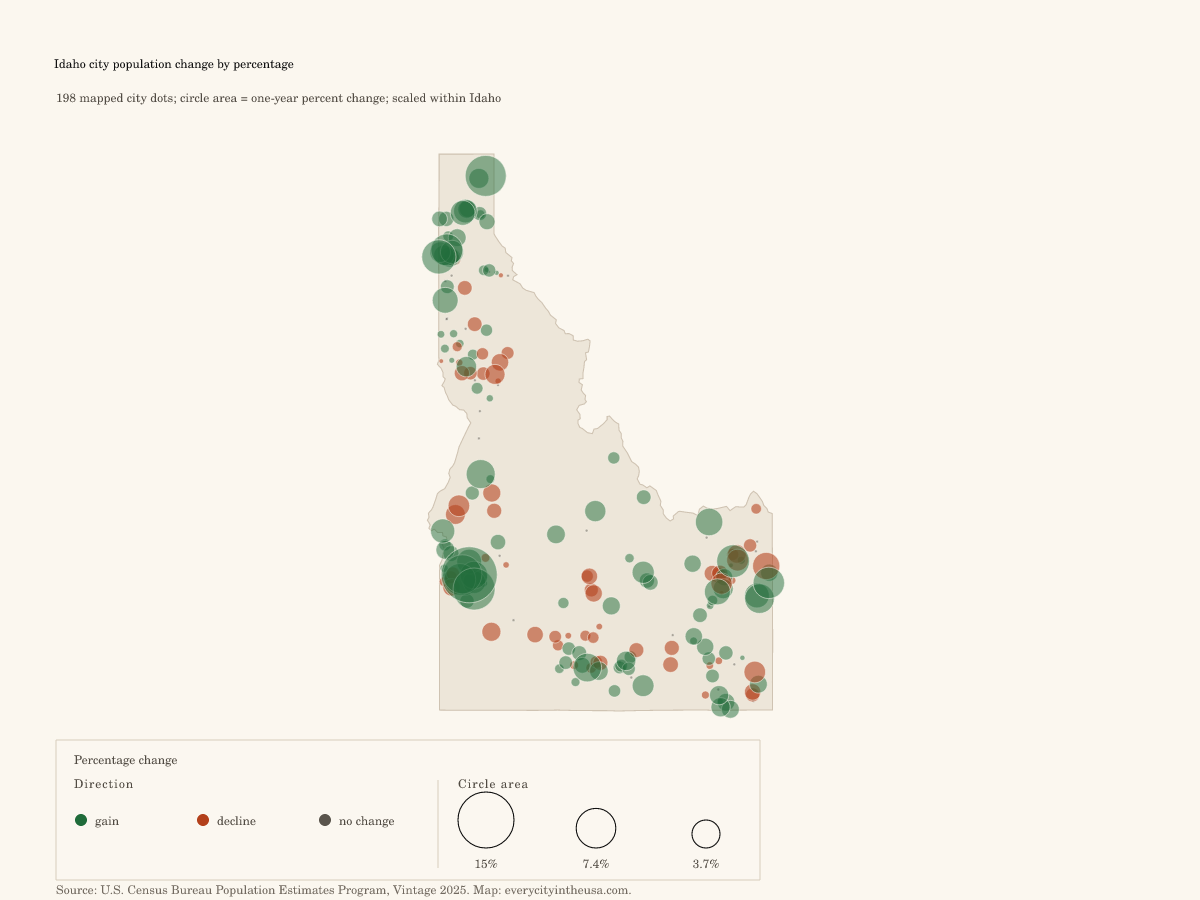
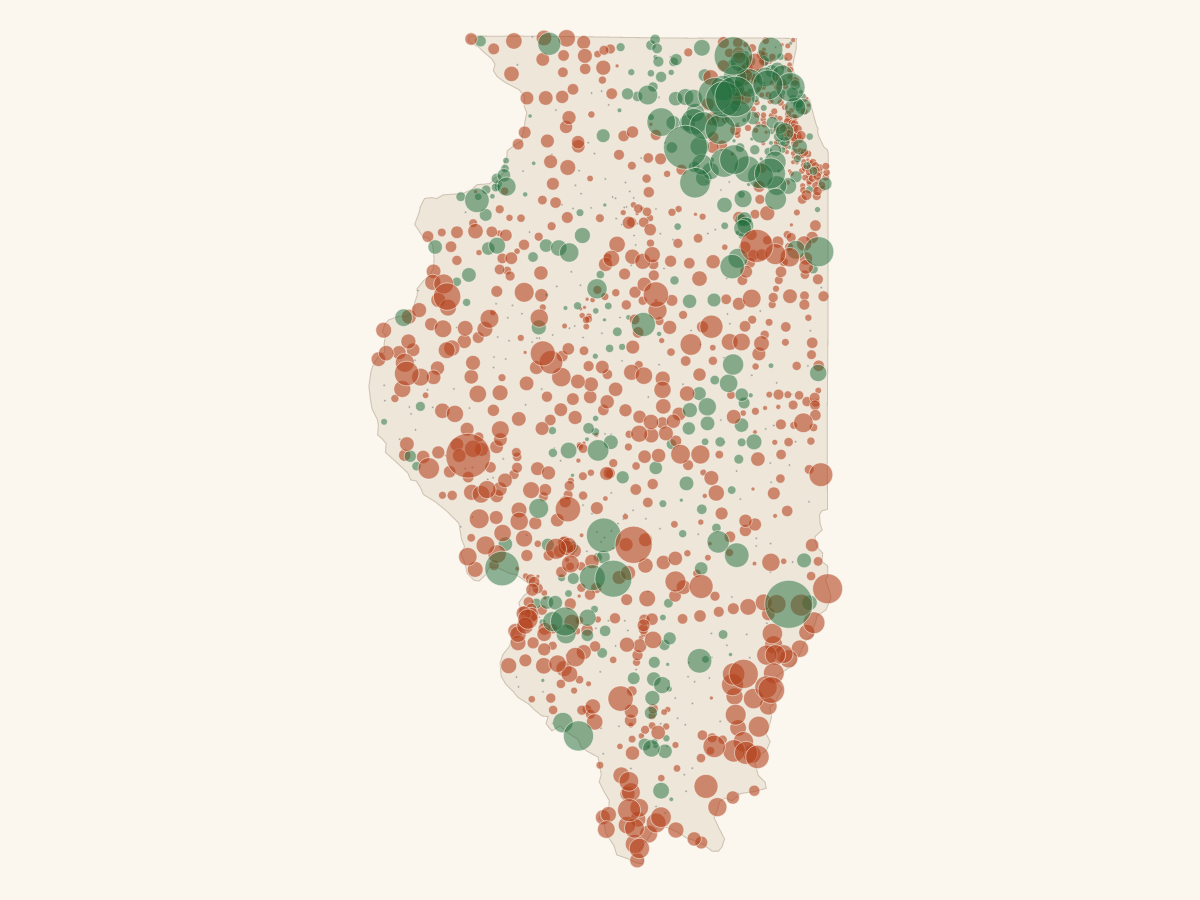
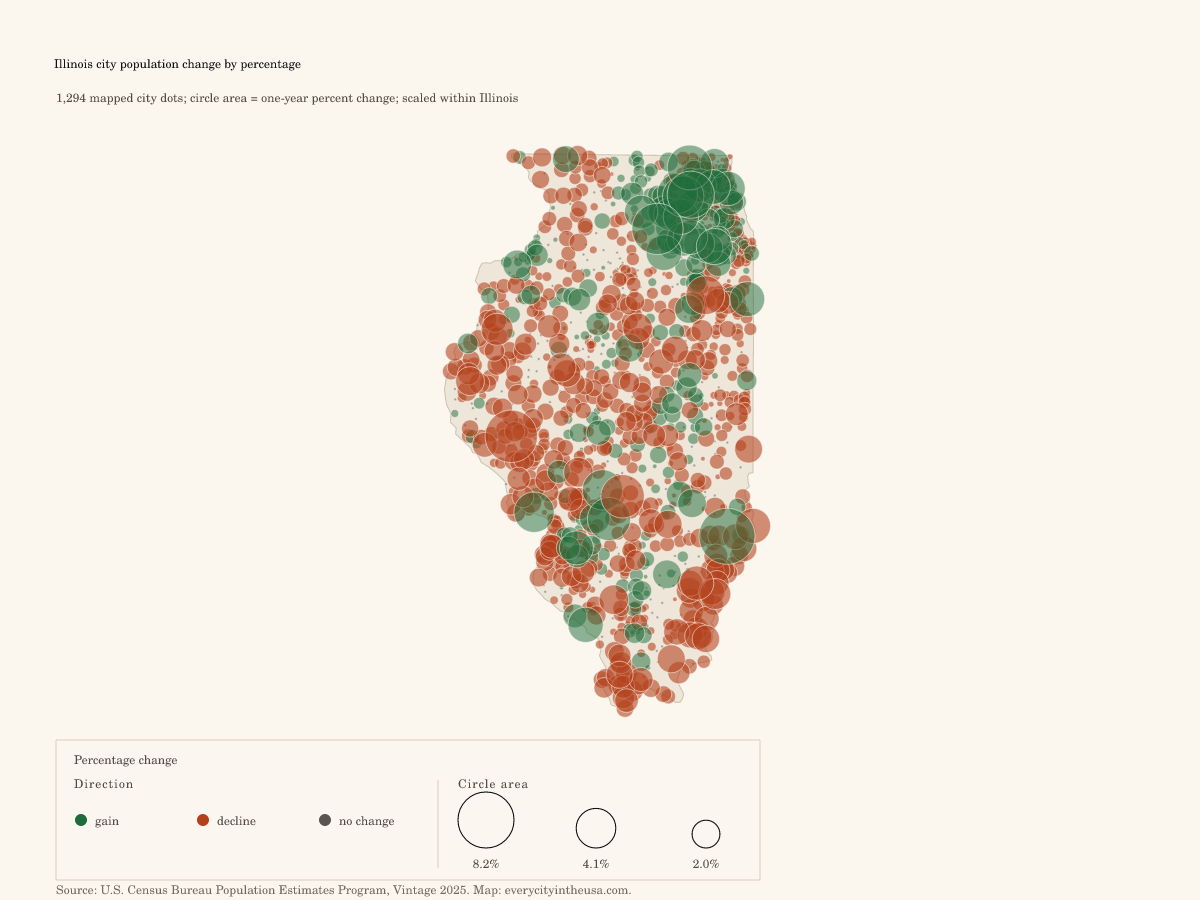
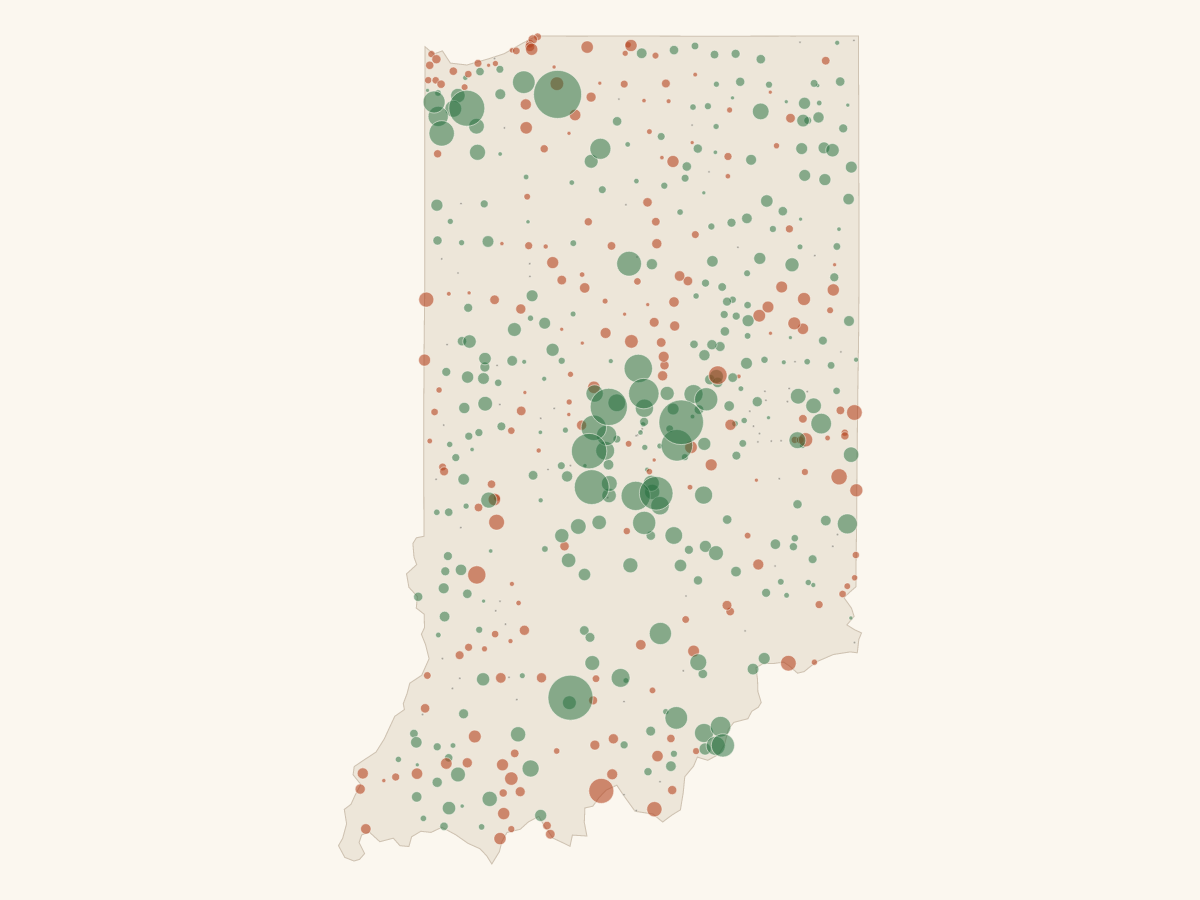
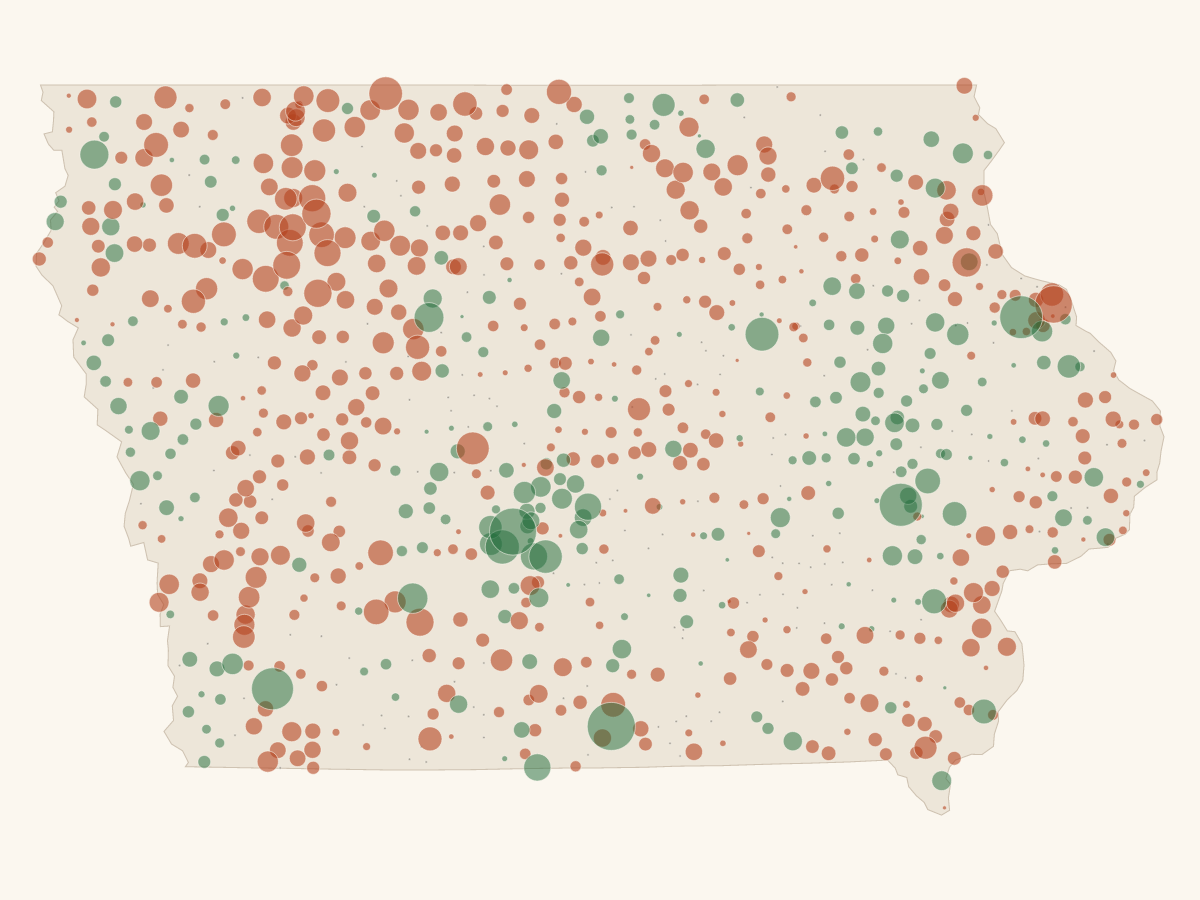
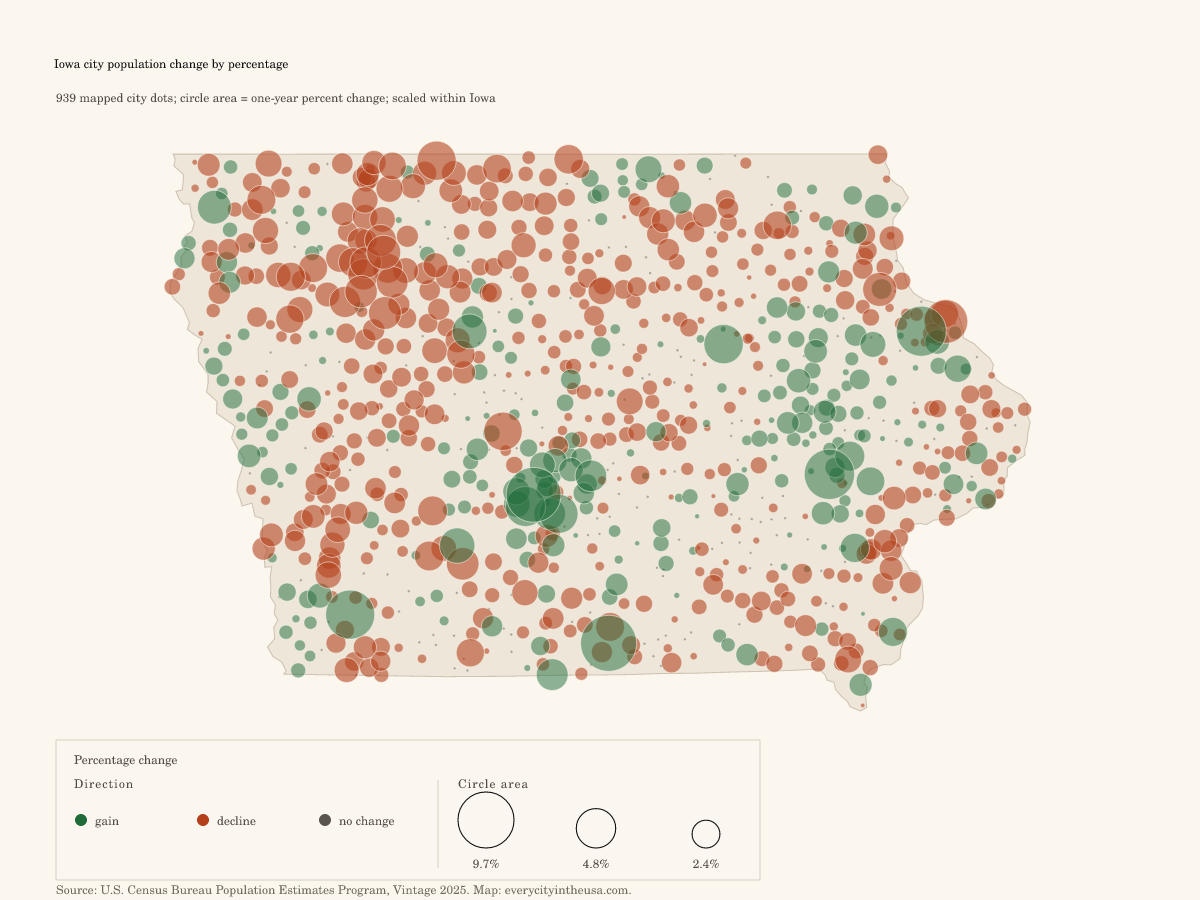
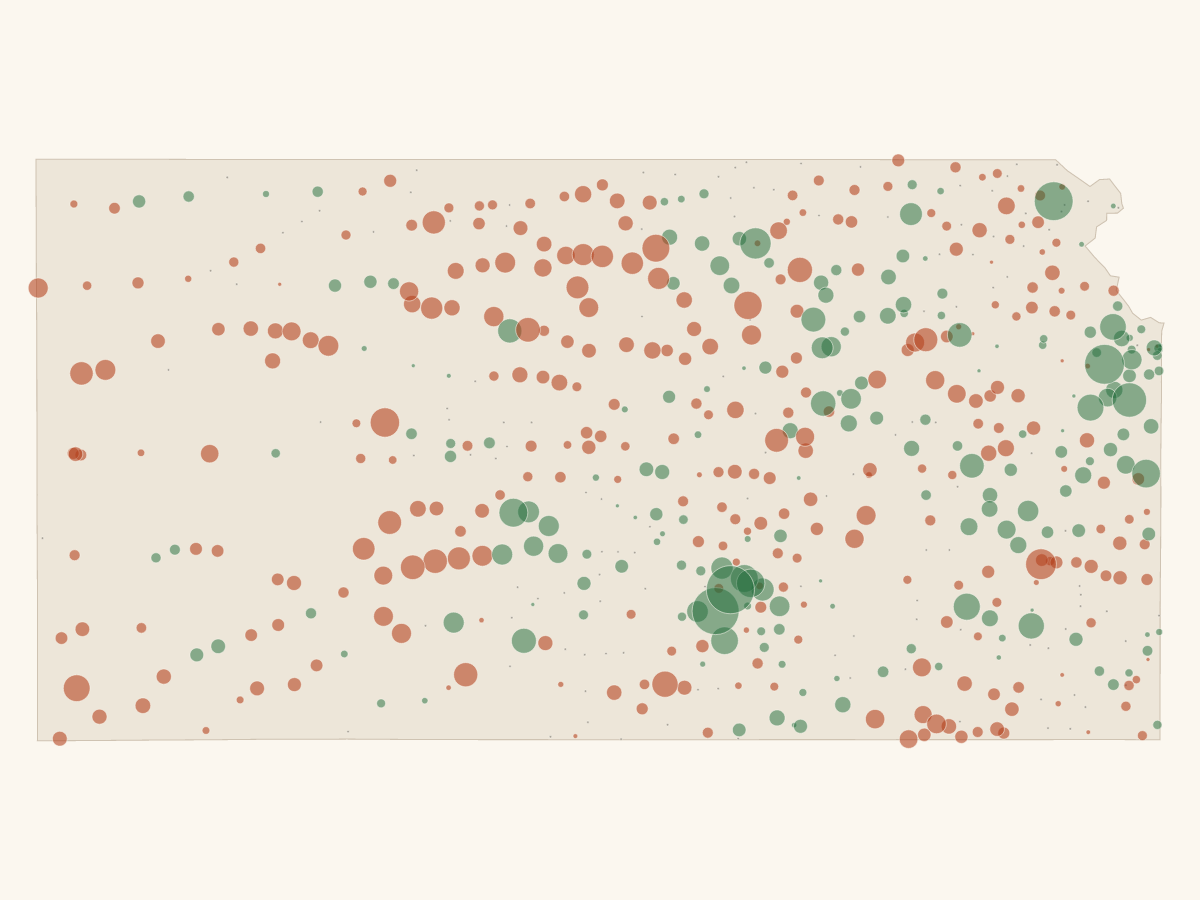
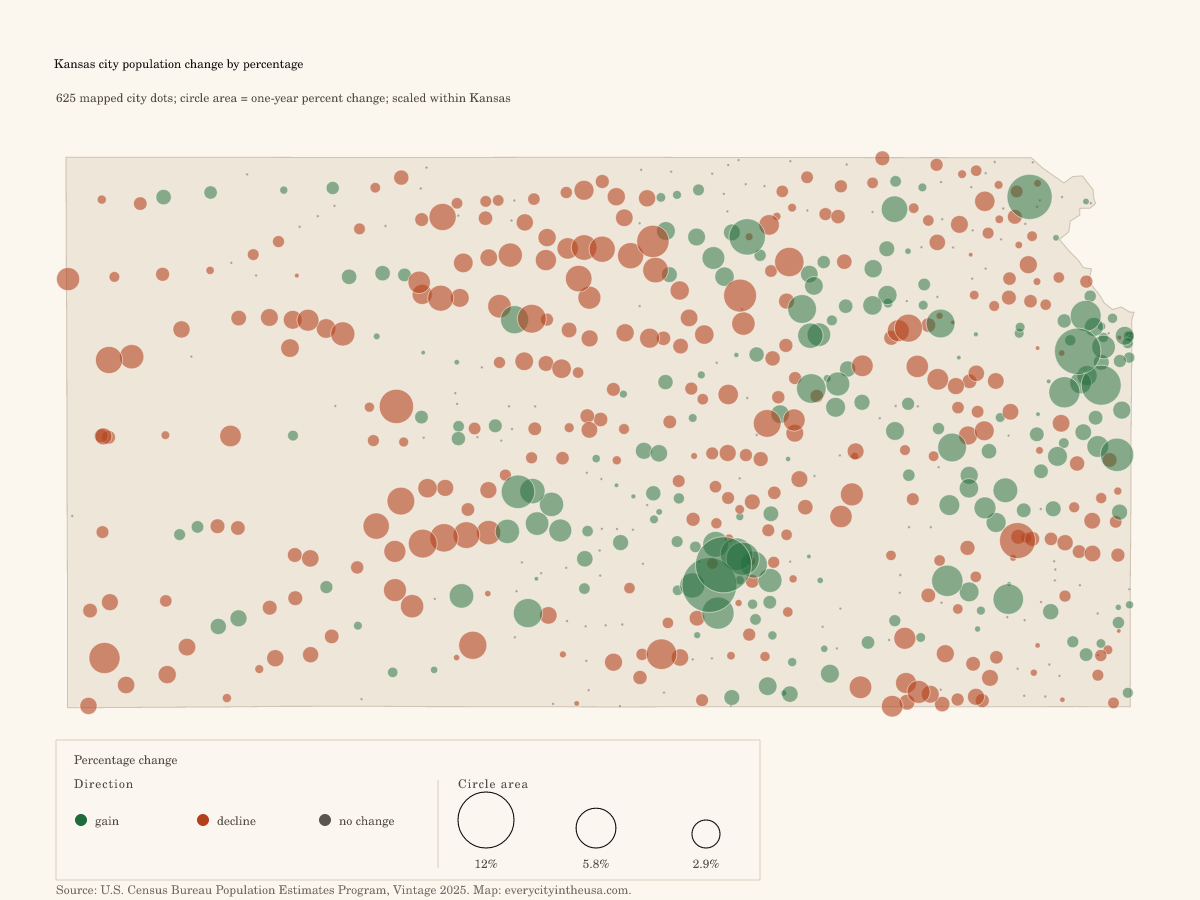
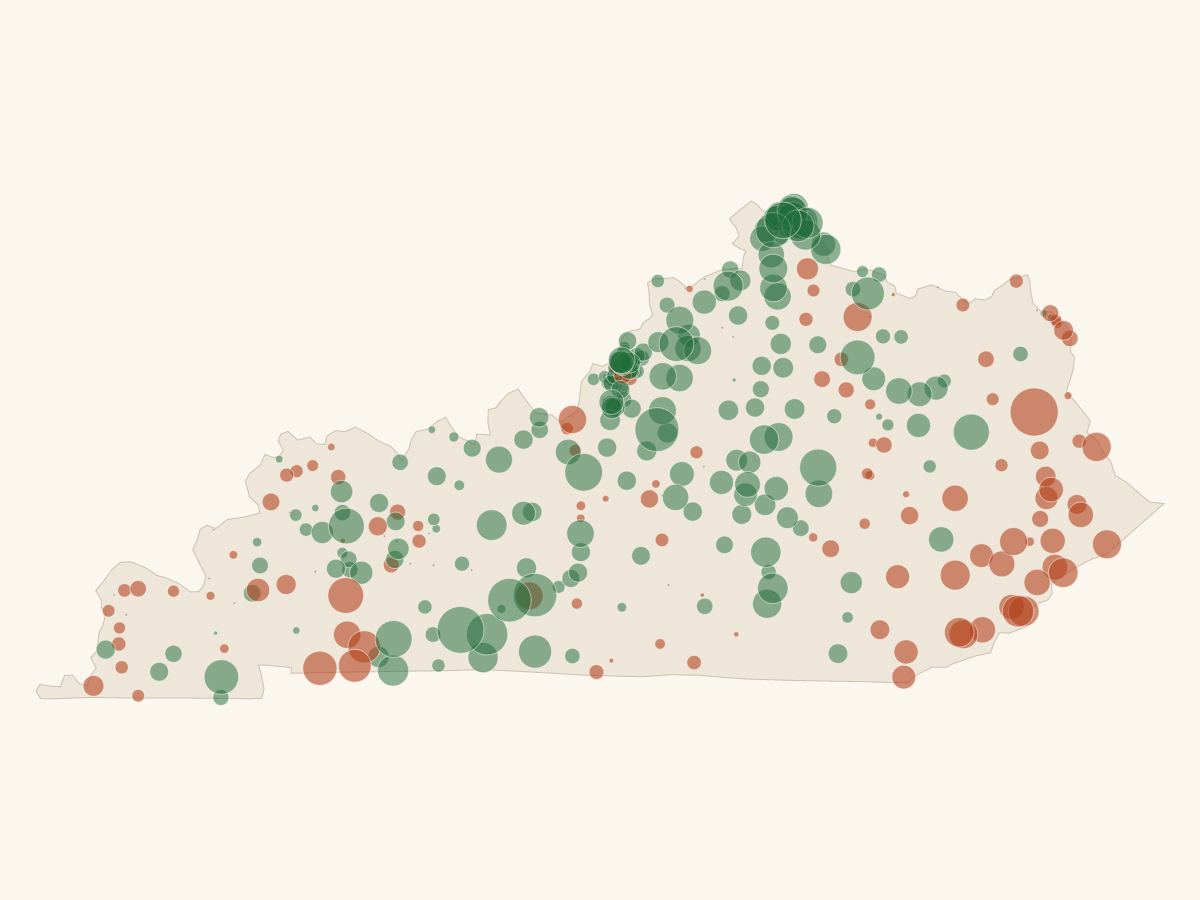
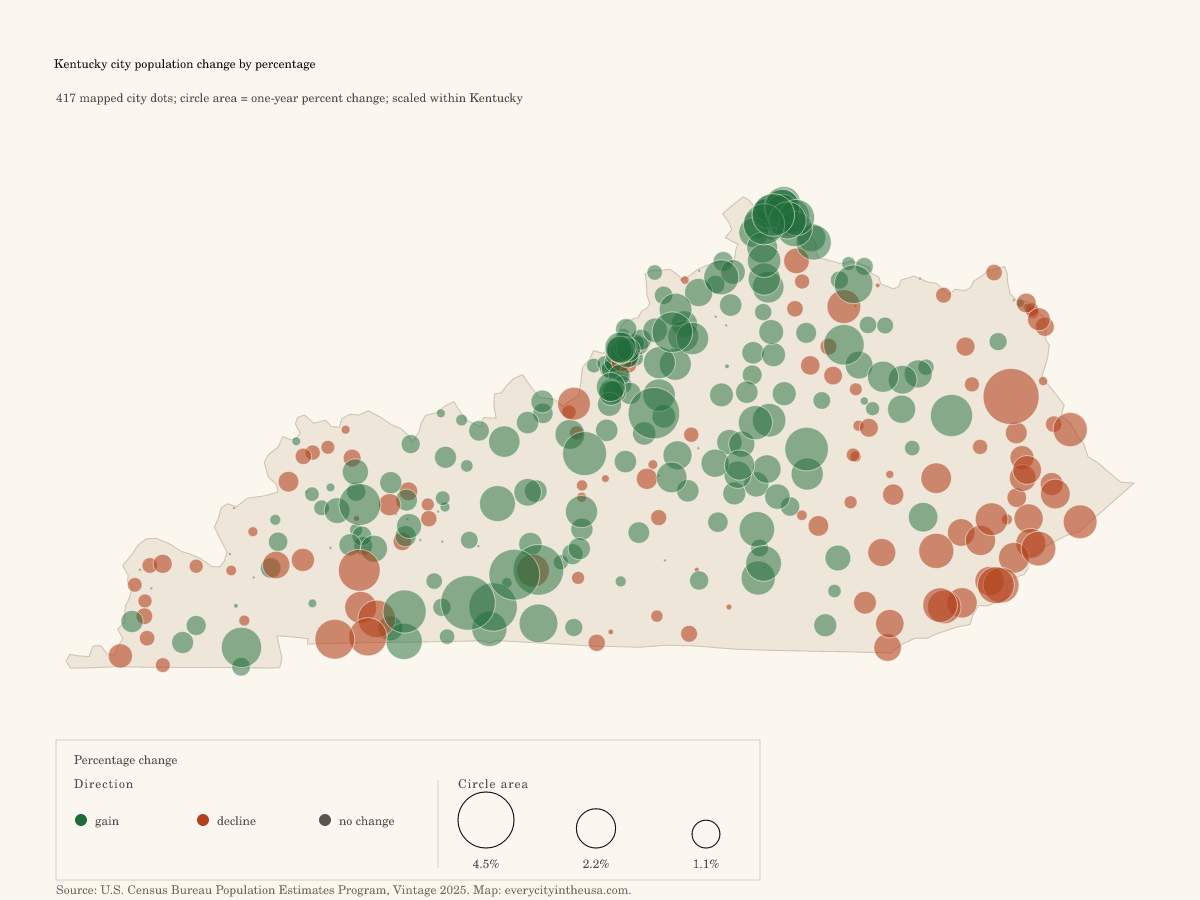
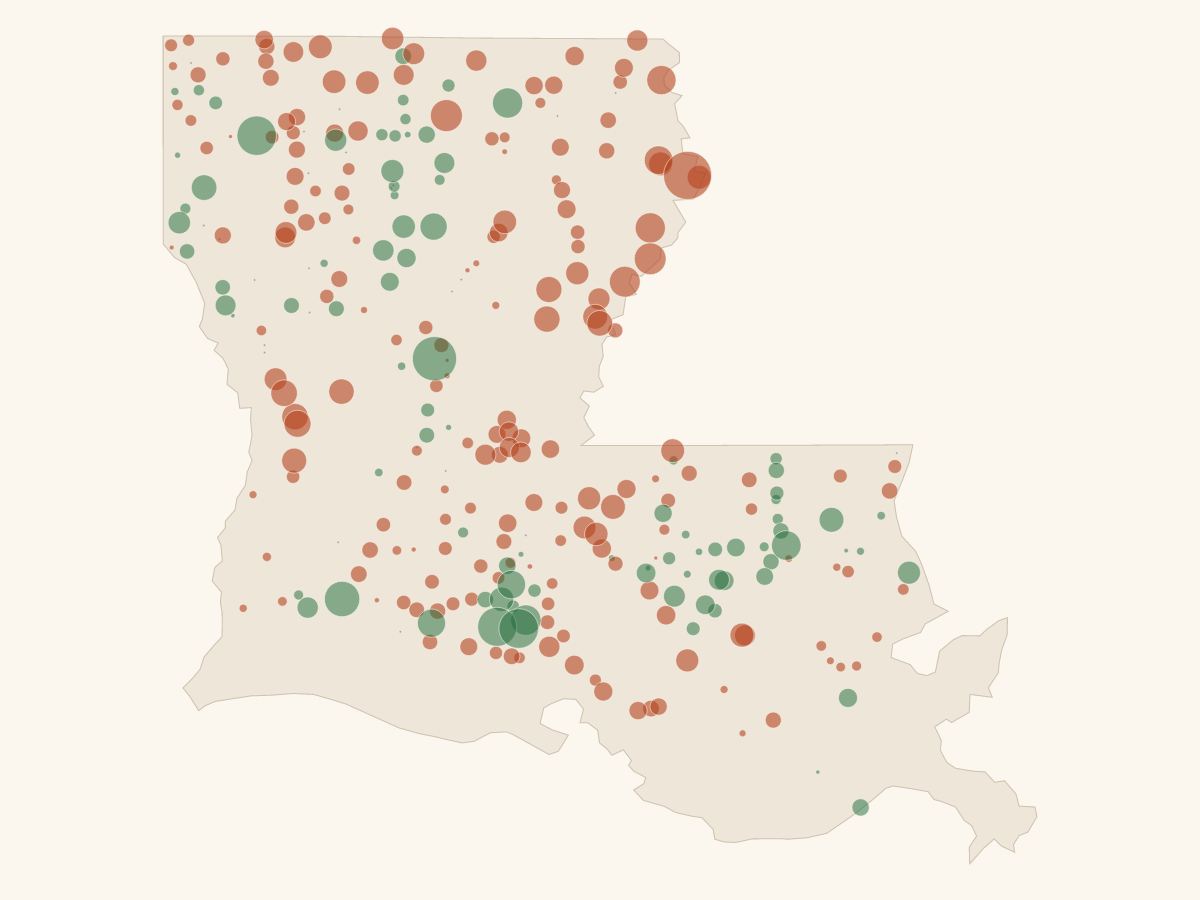
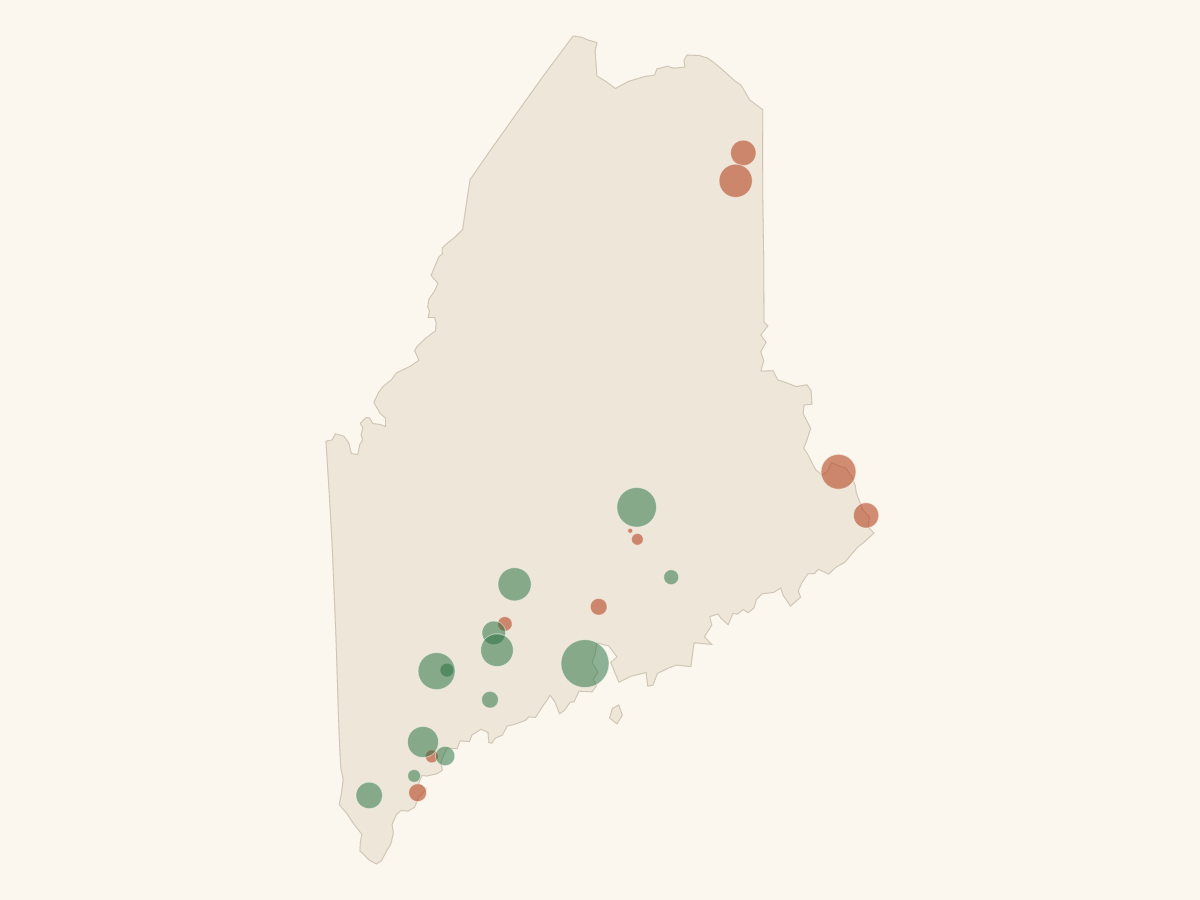
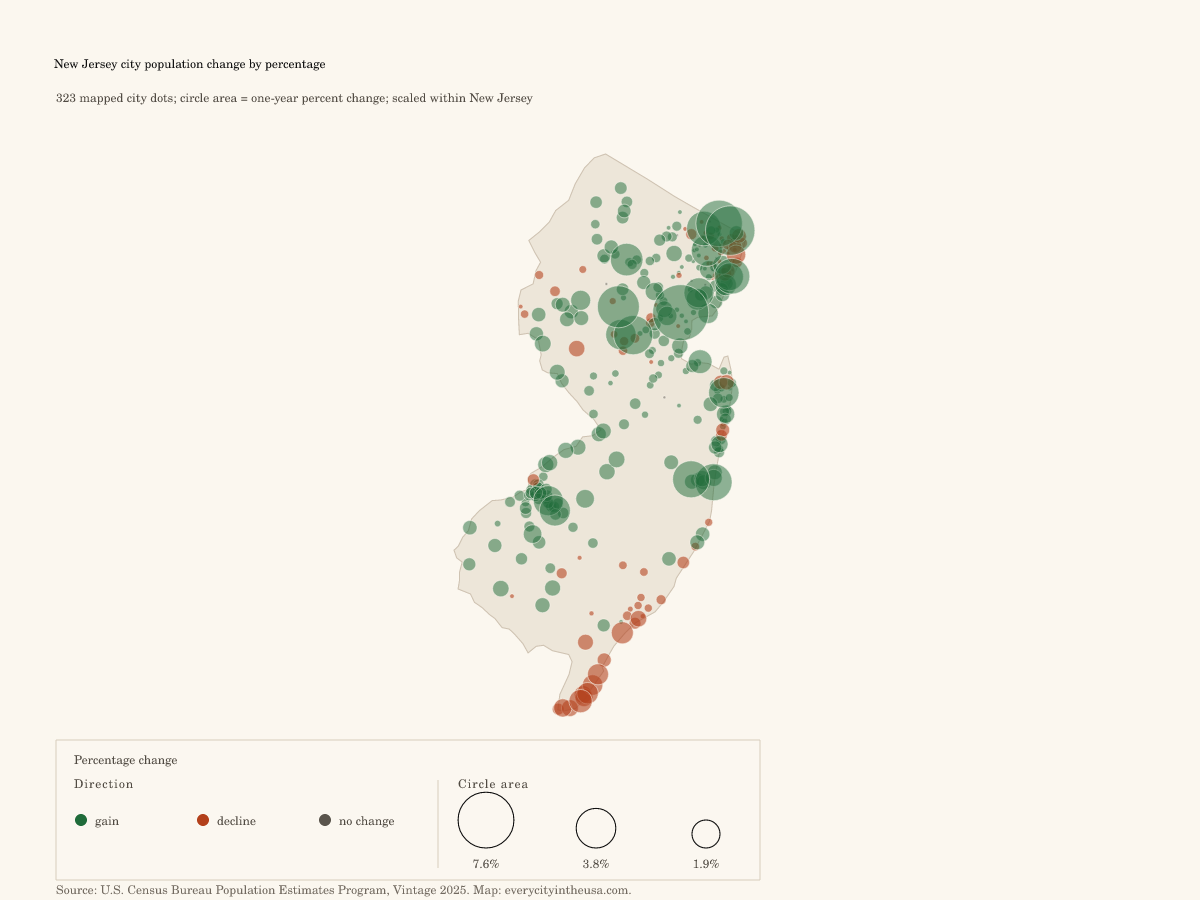
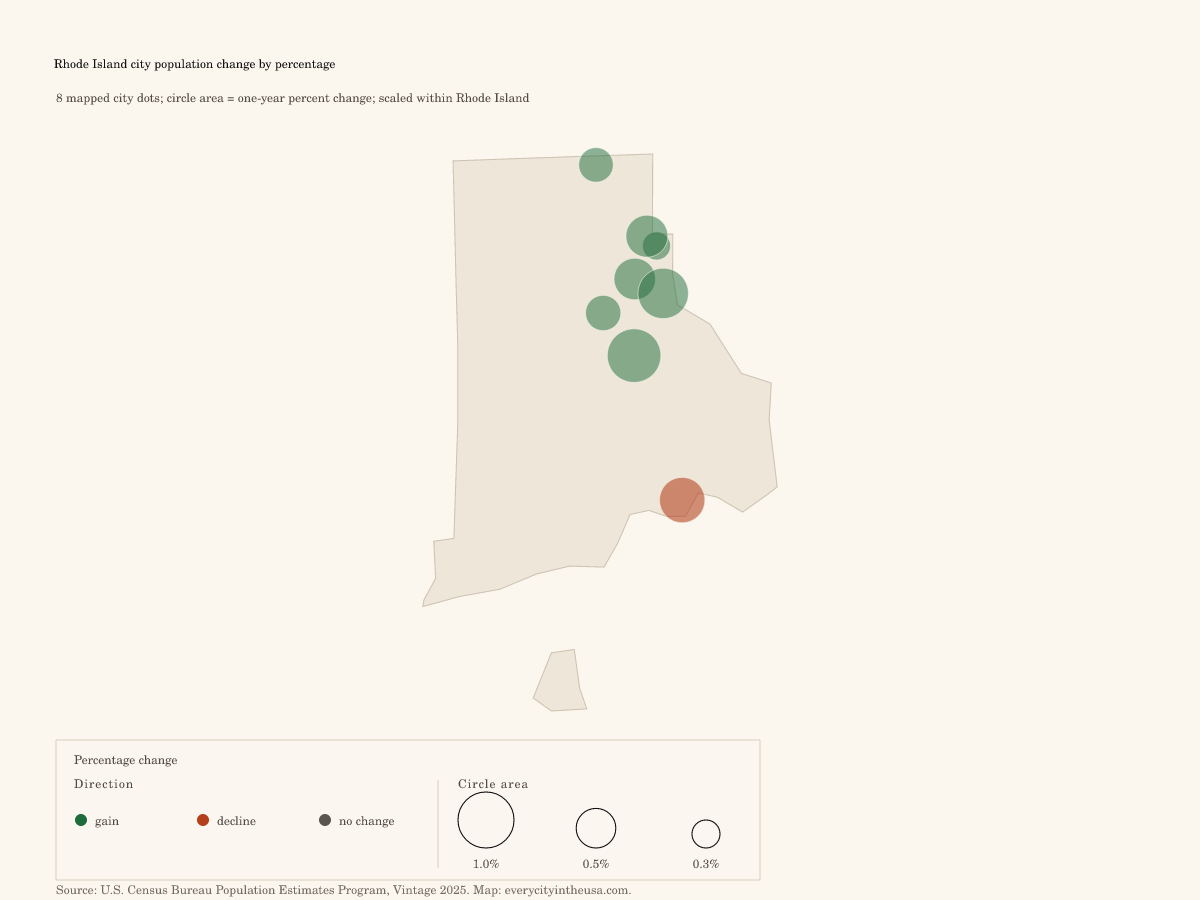
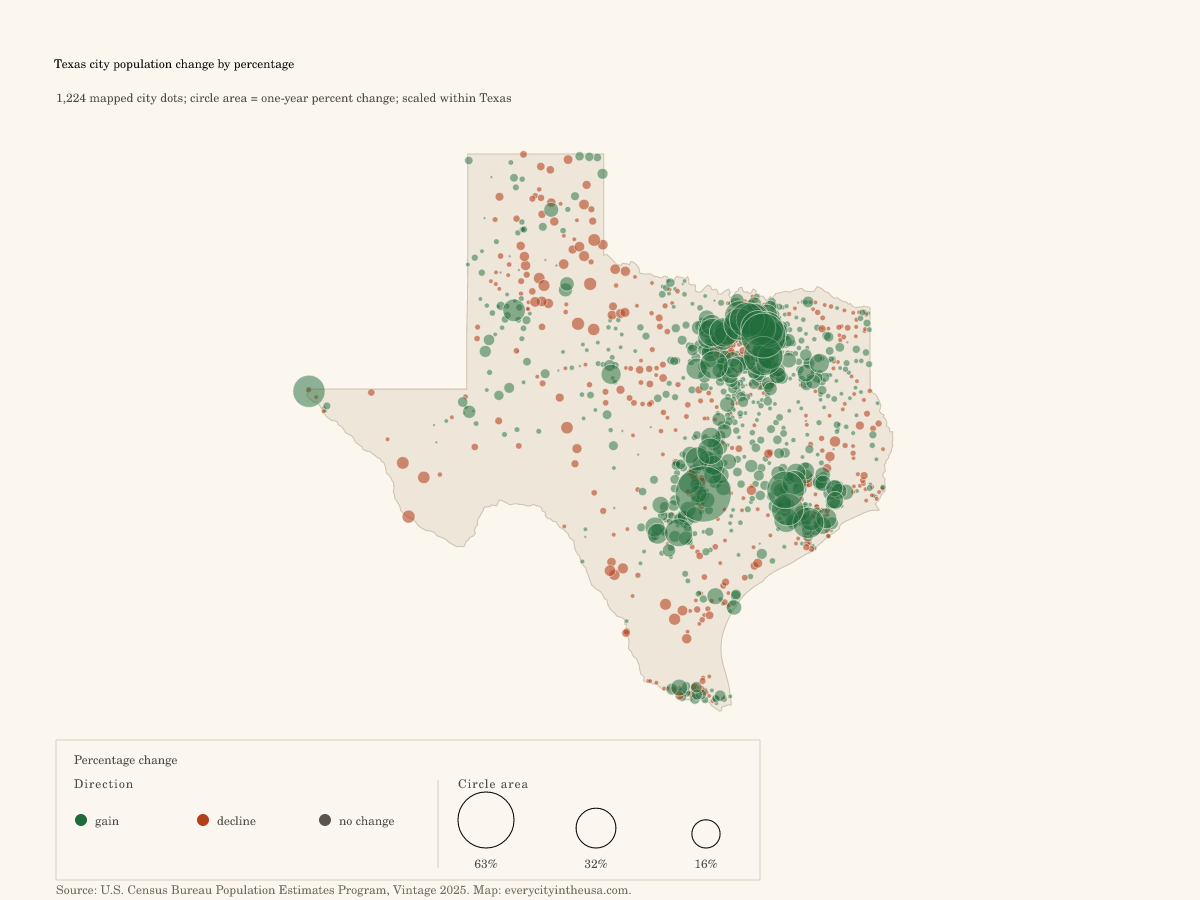
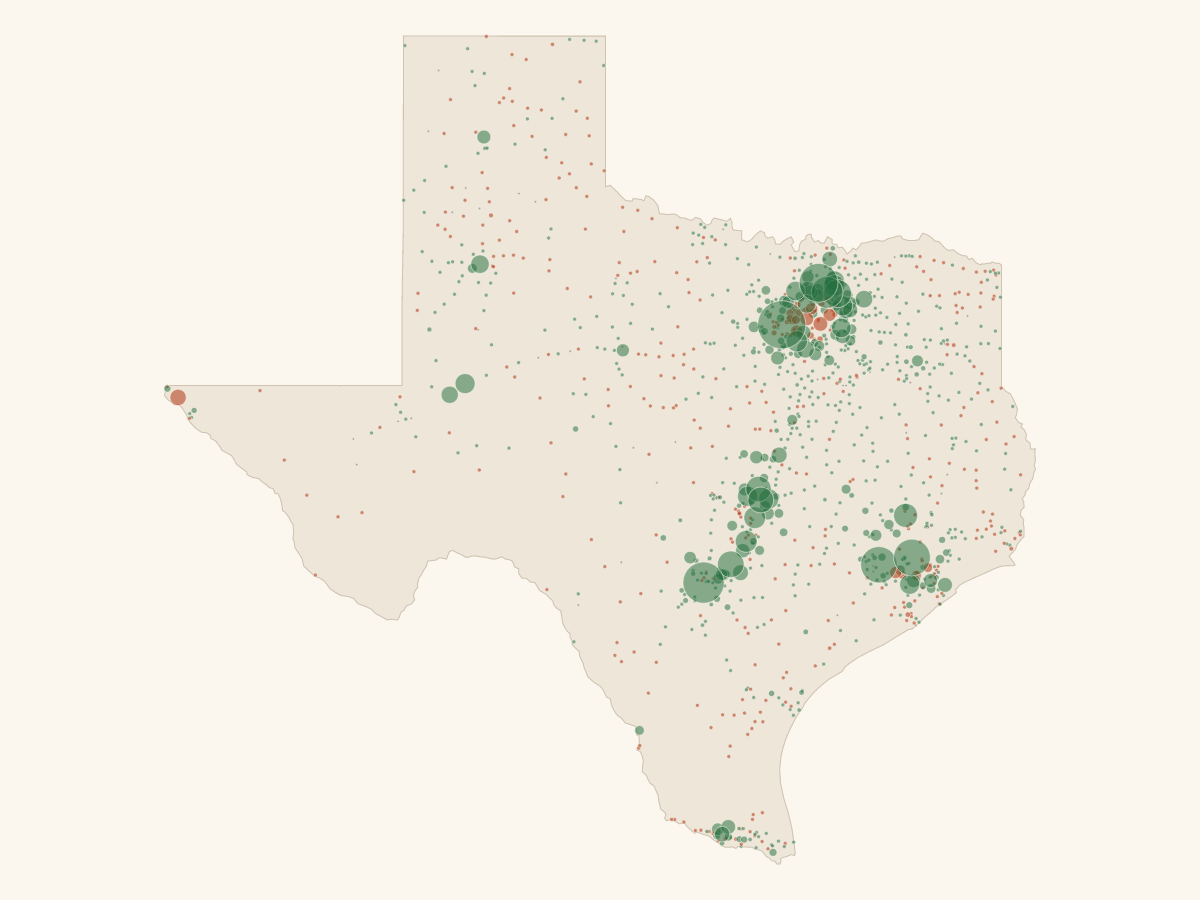
This lead view scales each city dot by one-year percentage change instead of residents gained or lost. It surfaces small-base places that barely register on the resident-count map, so use it alongside population and numeric change.
Percentage change is calculated as 2025 population minus 2024 population, divided by 2024 population. Small populations can produce visually large percentage swings from modest numeric changes.
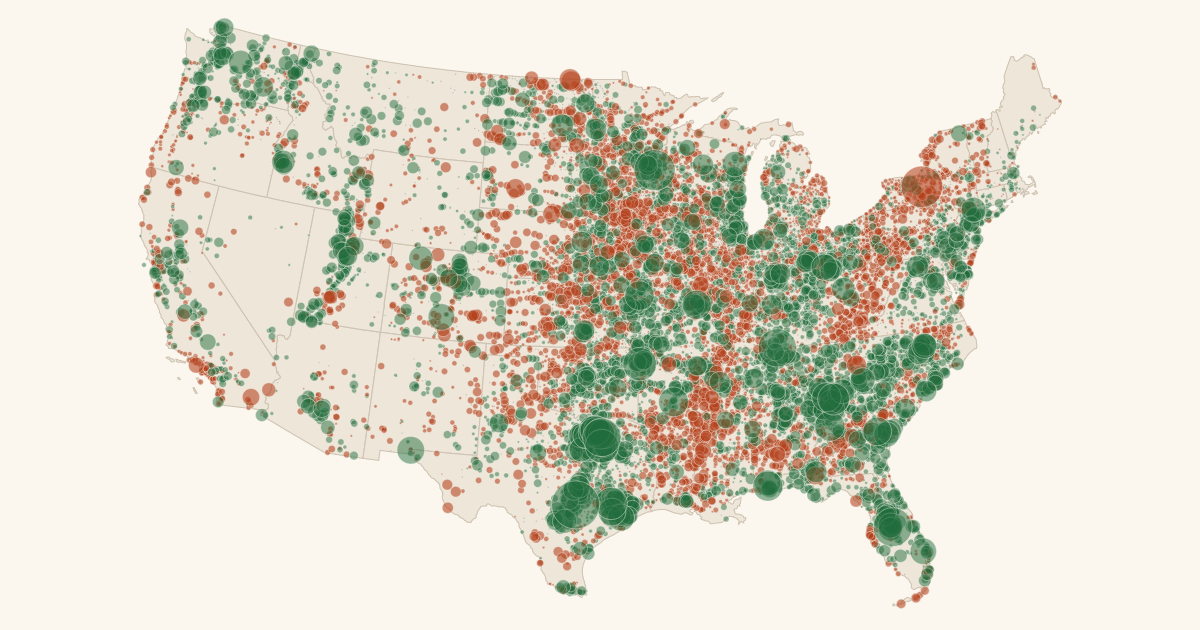
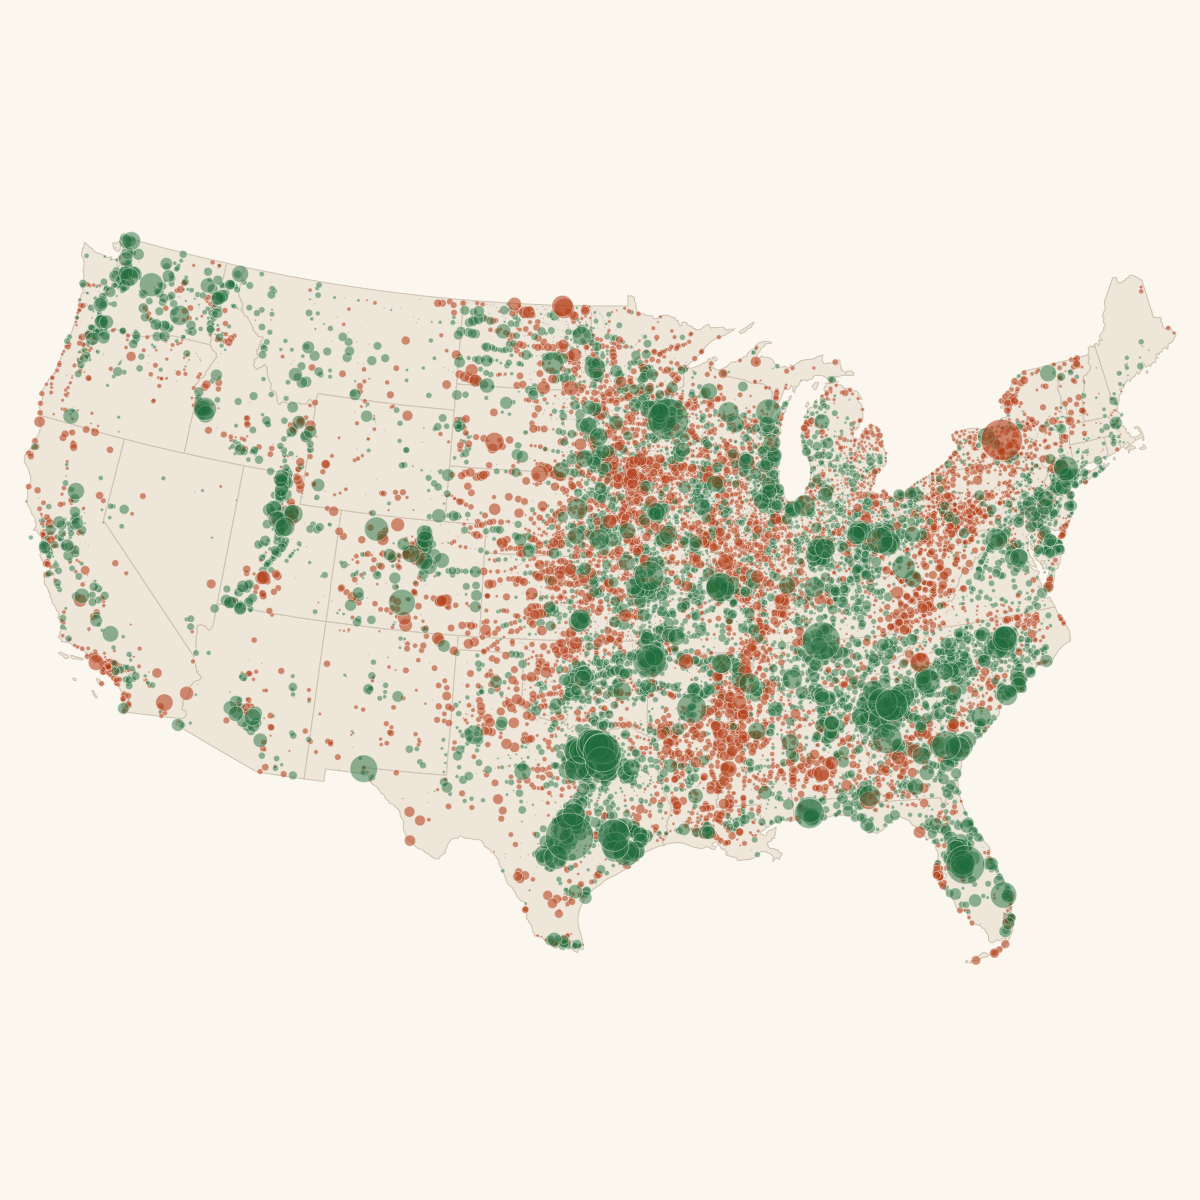
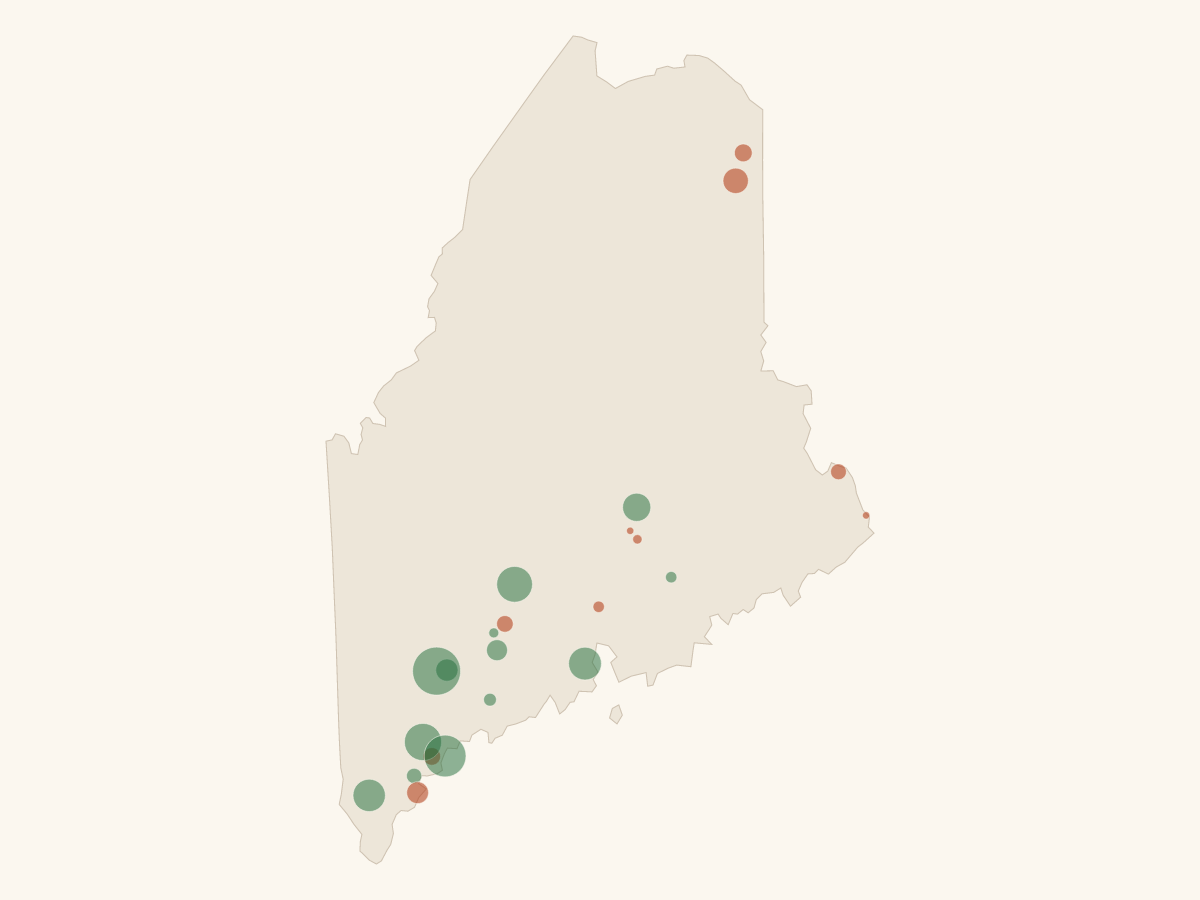
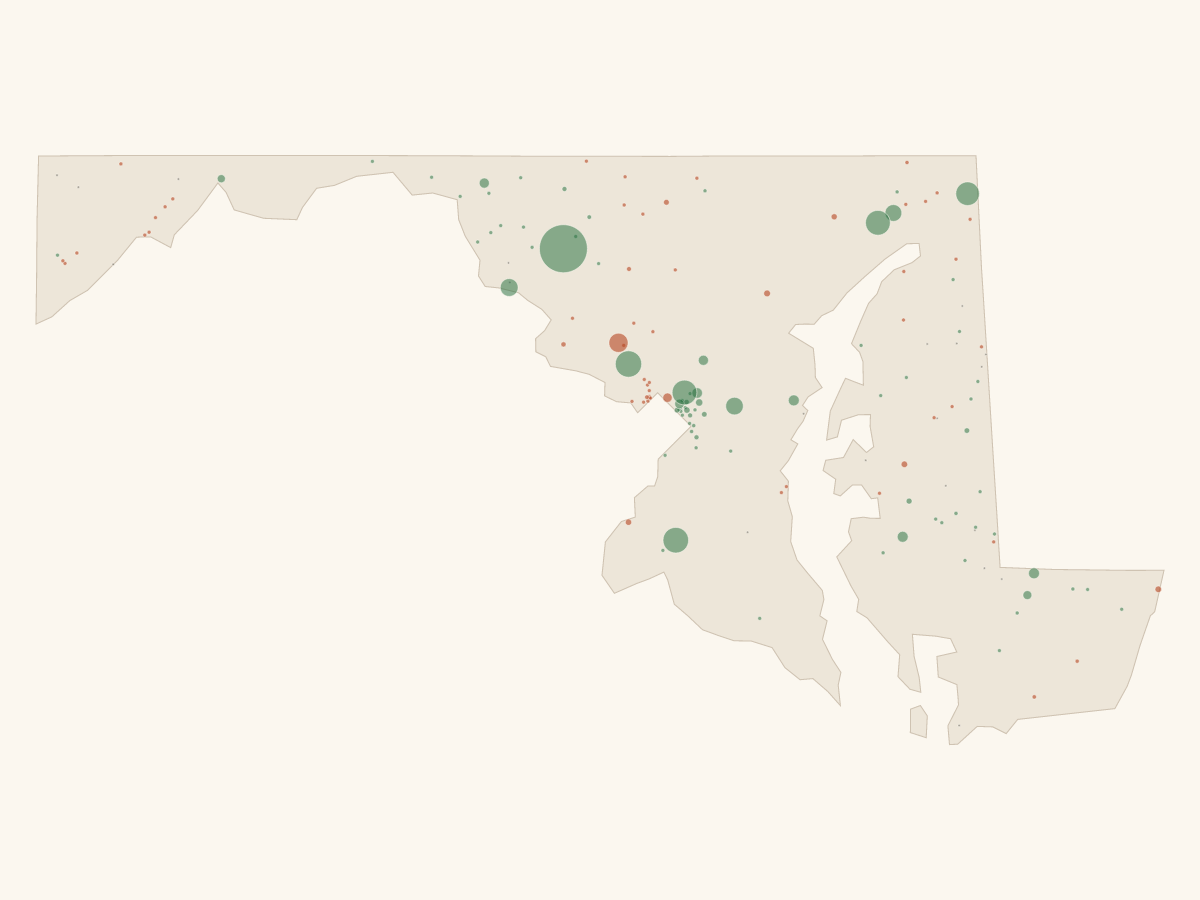
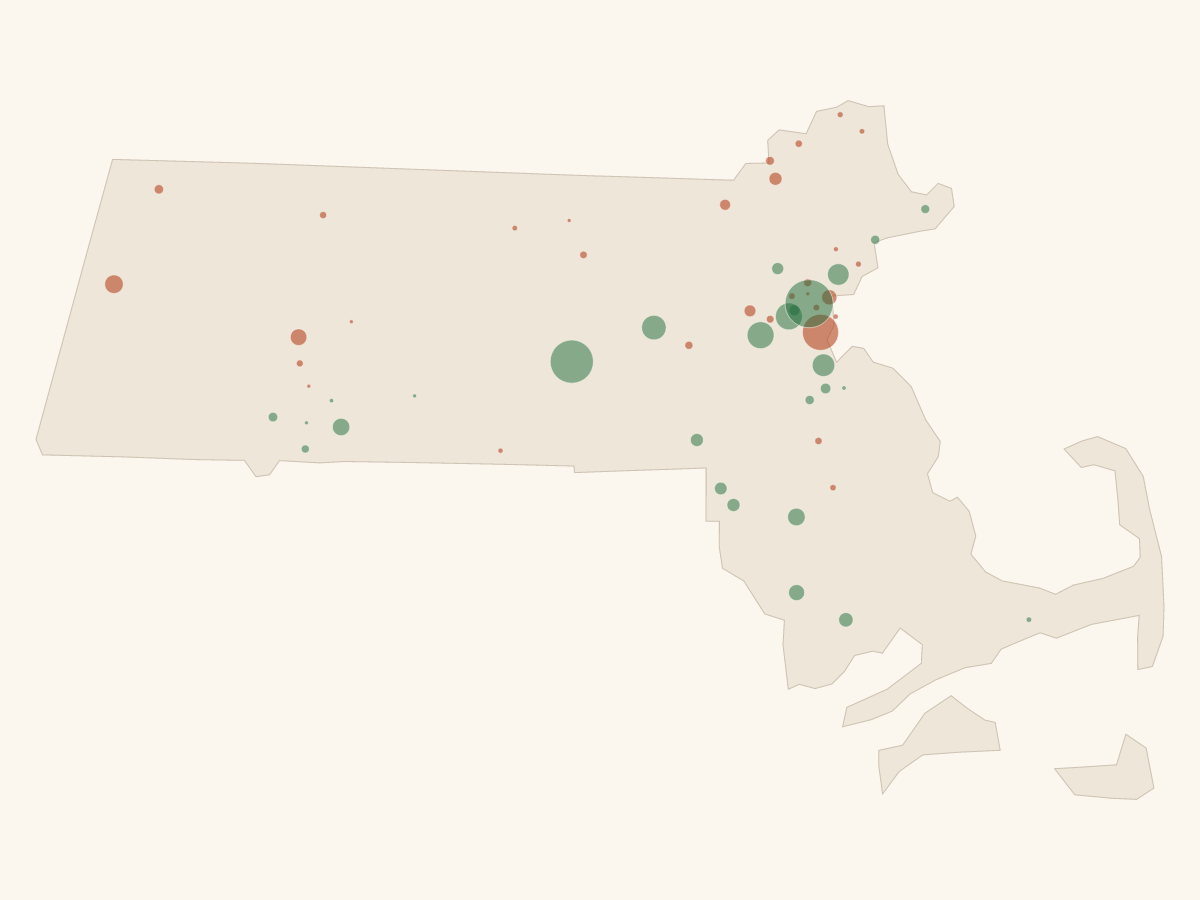
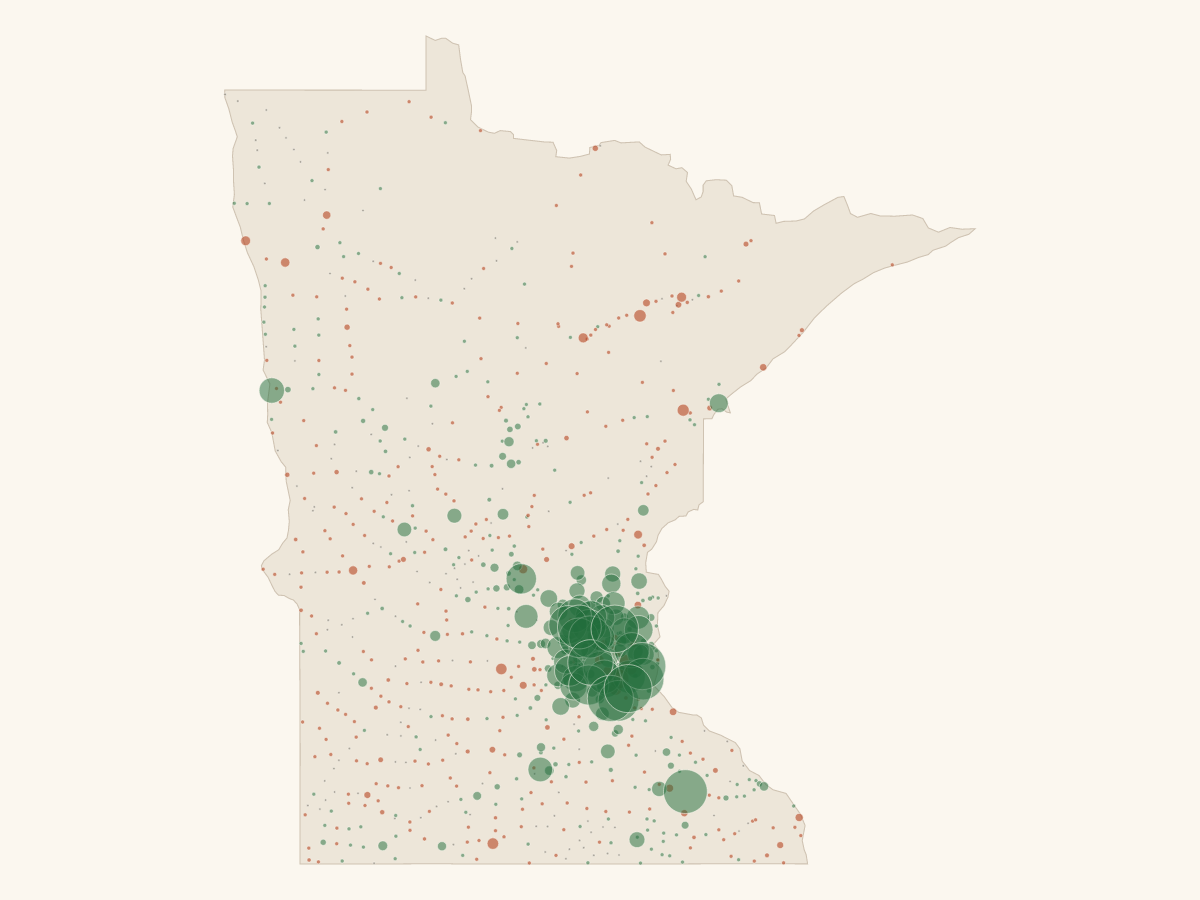
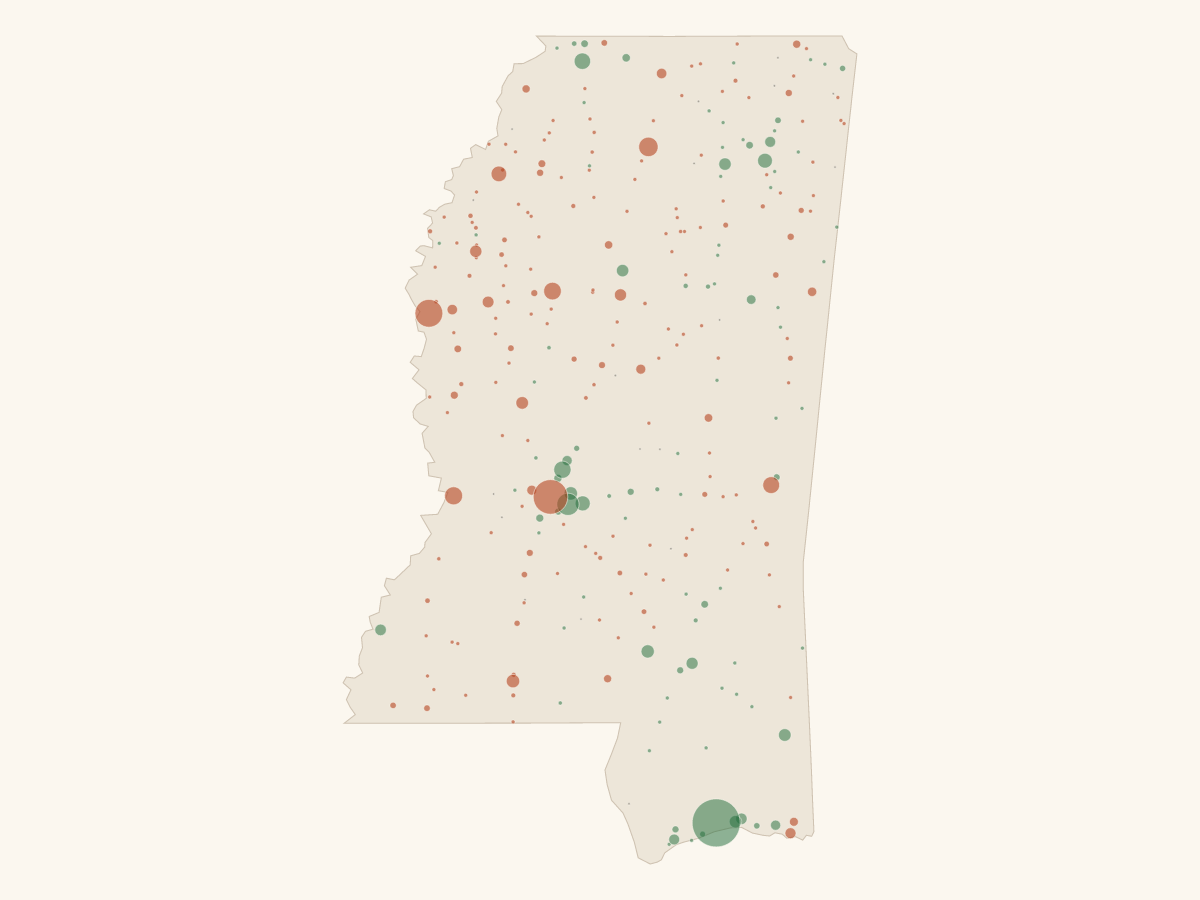
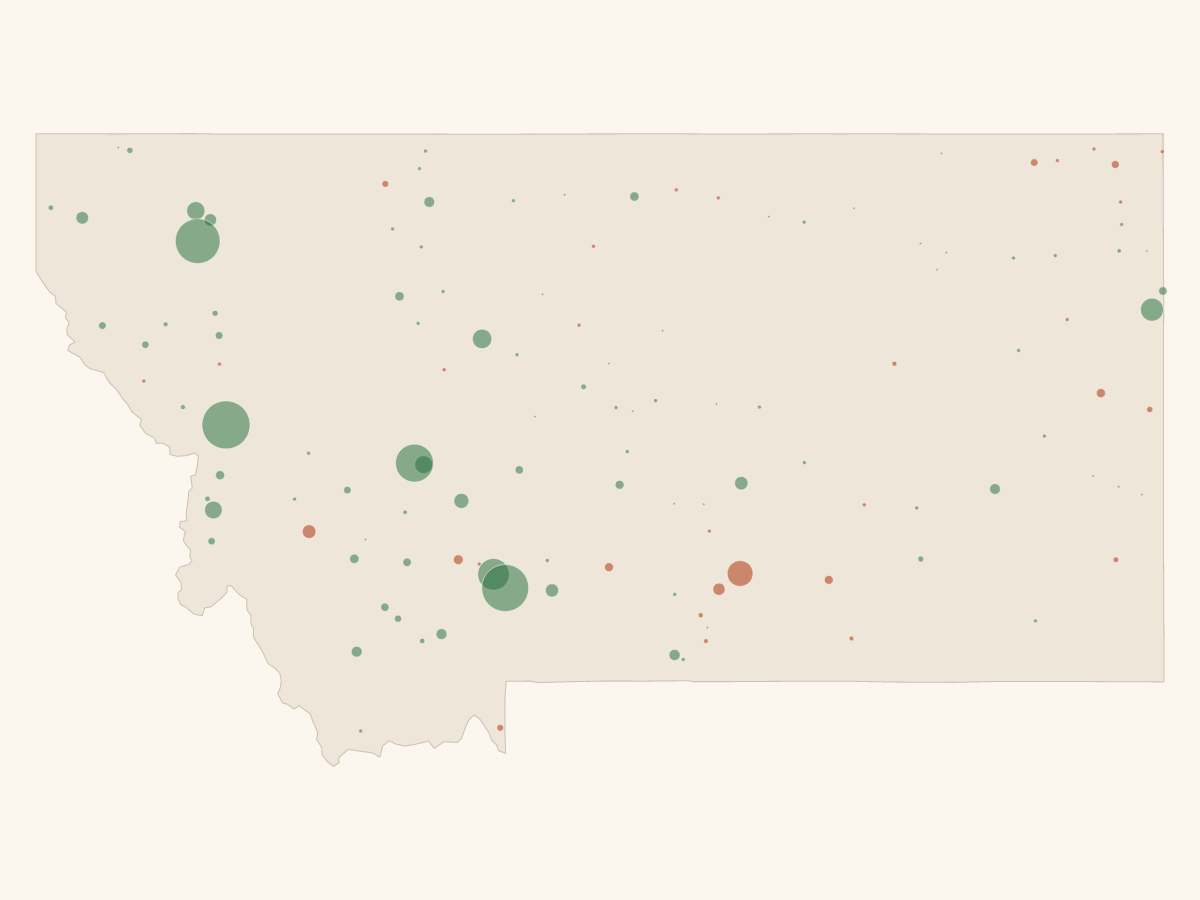
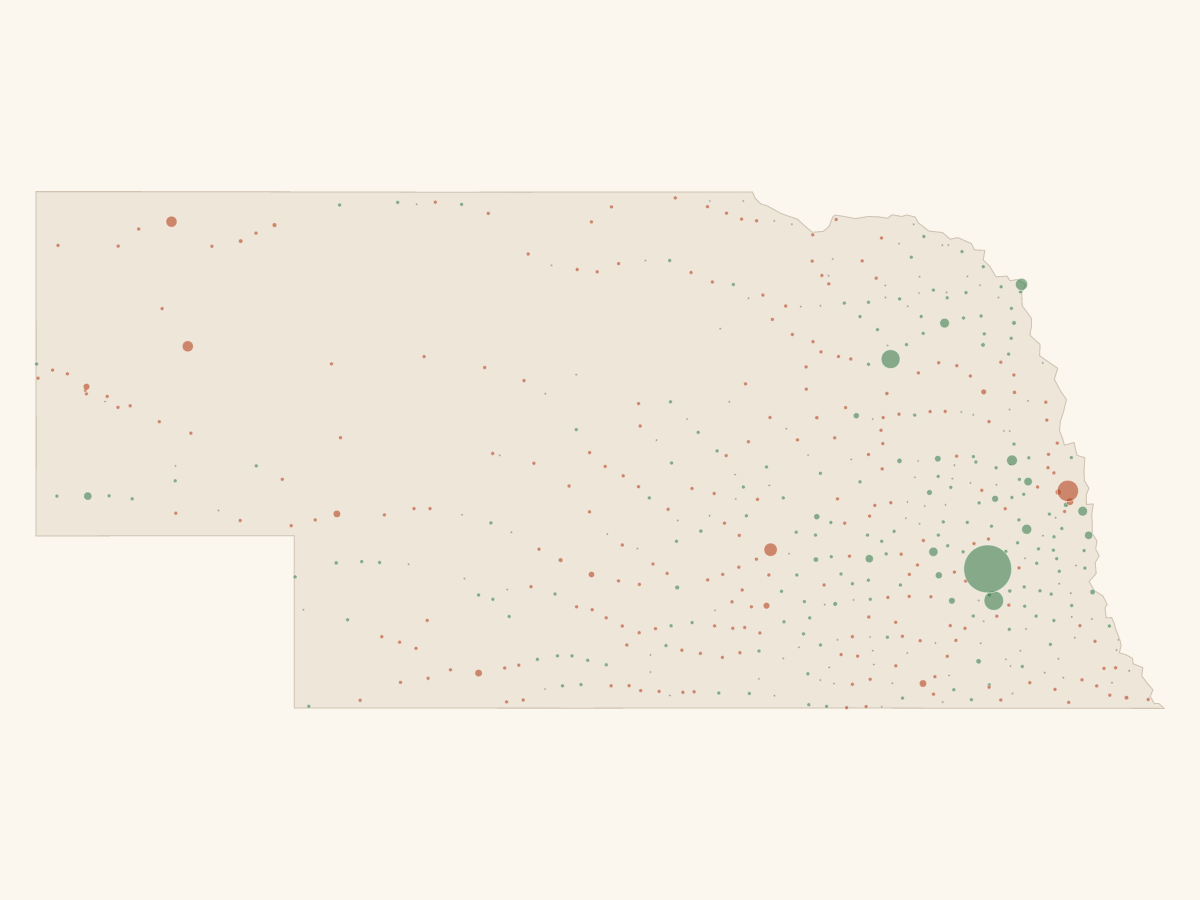
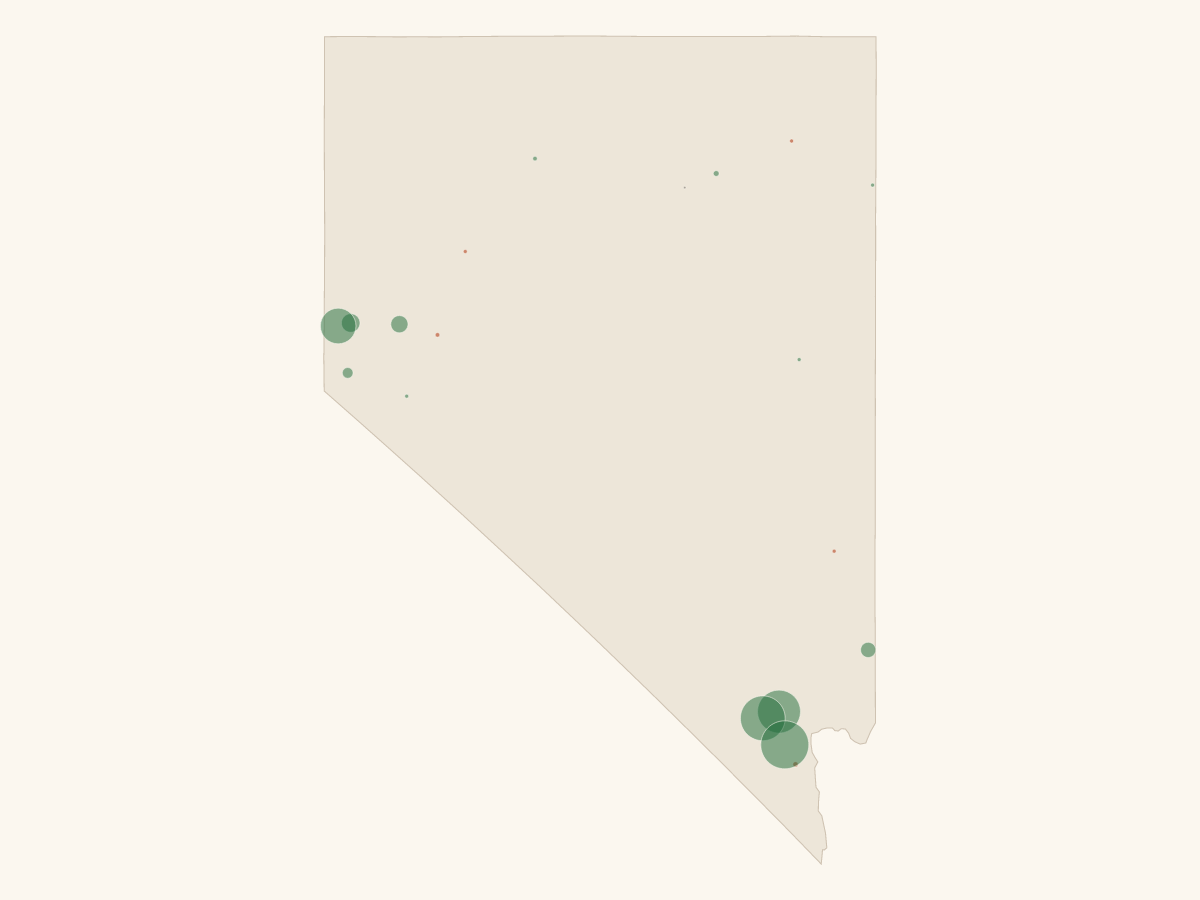
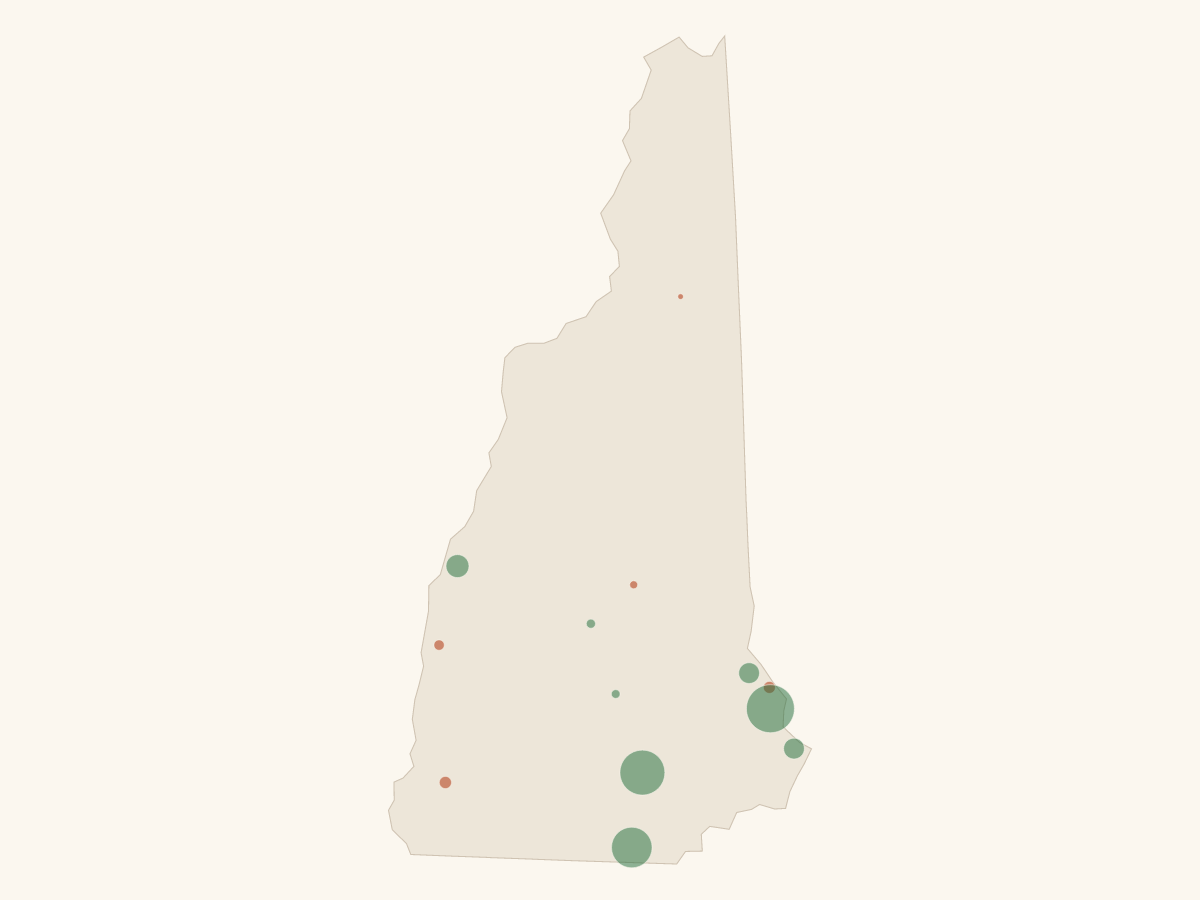
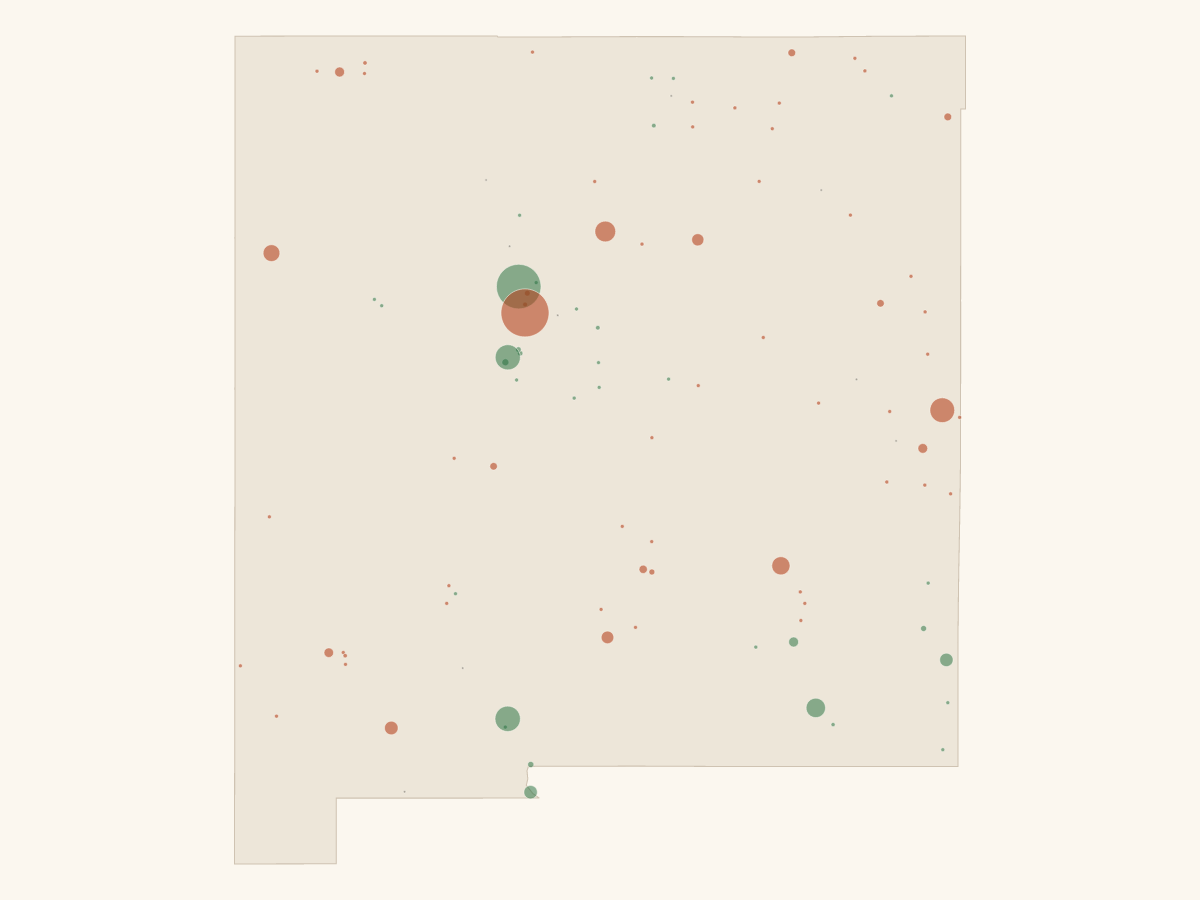
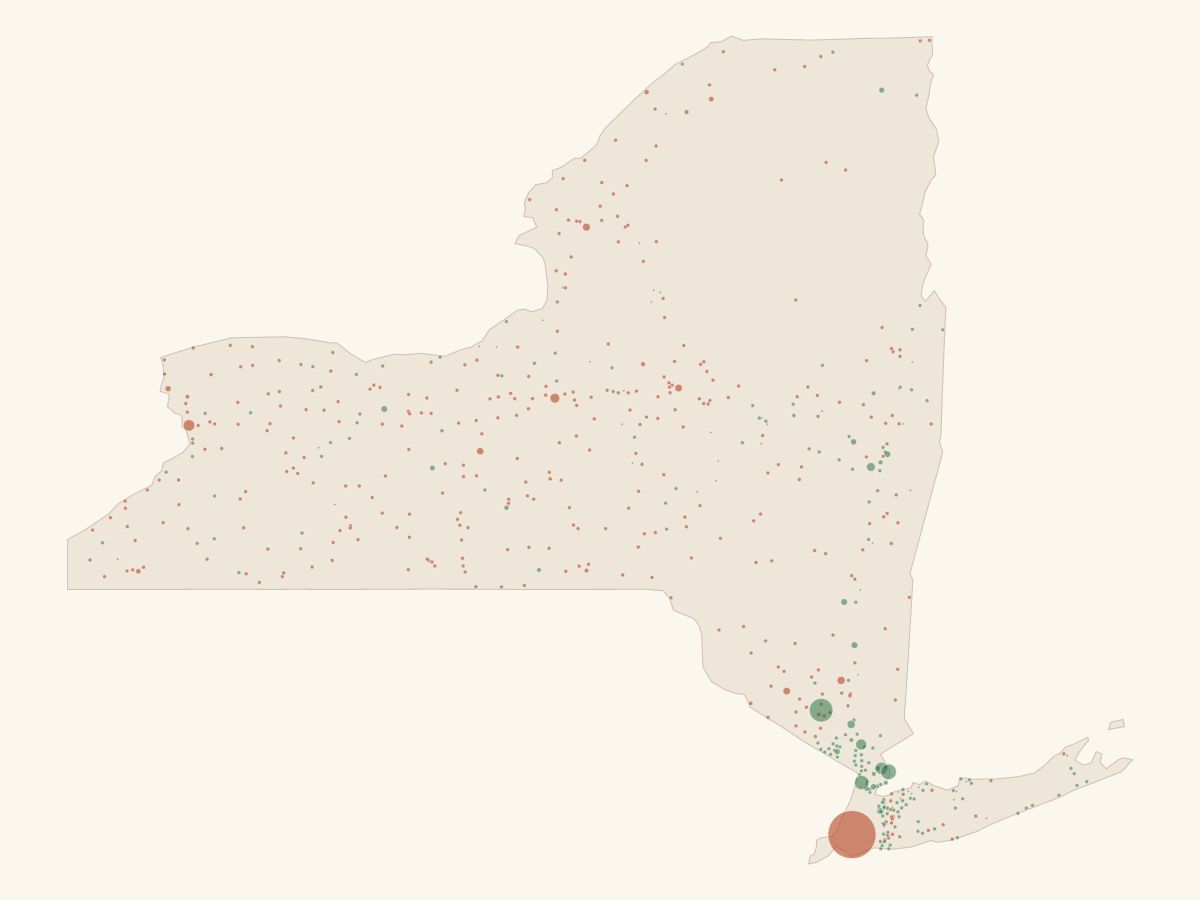
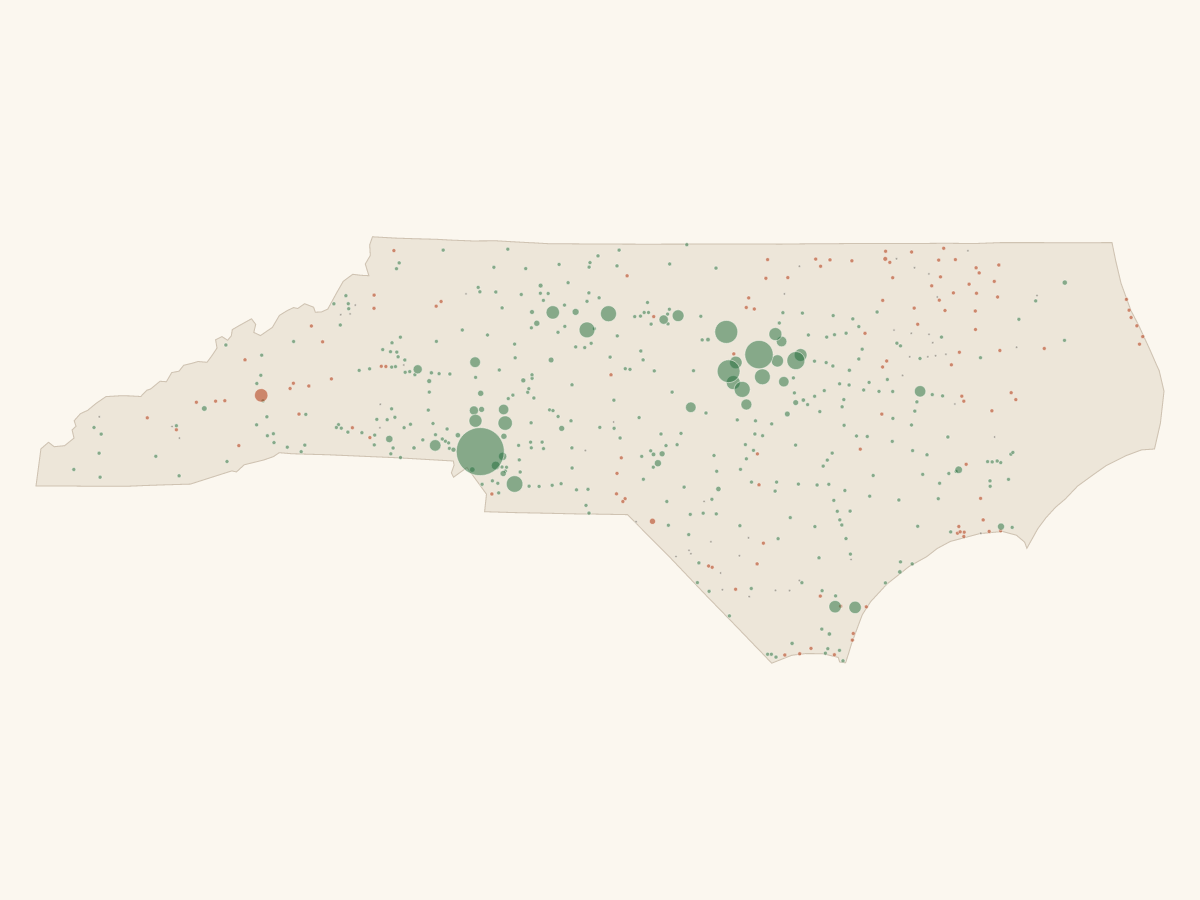
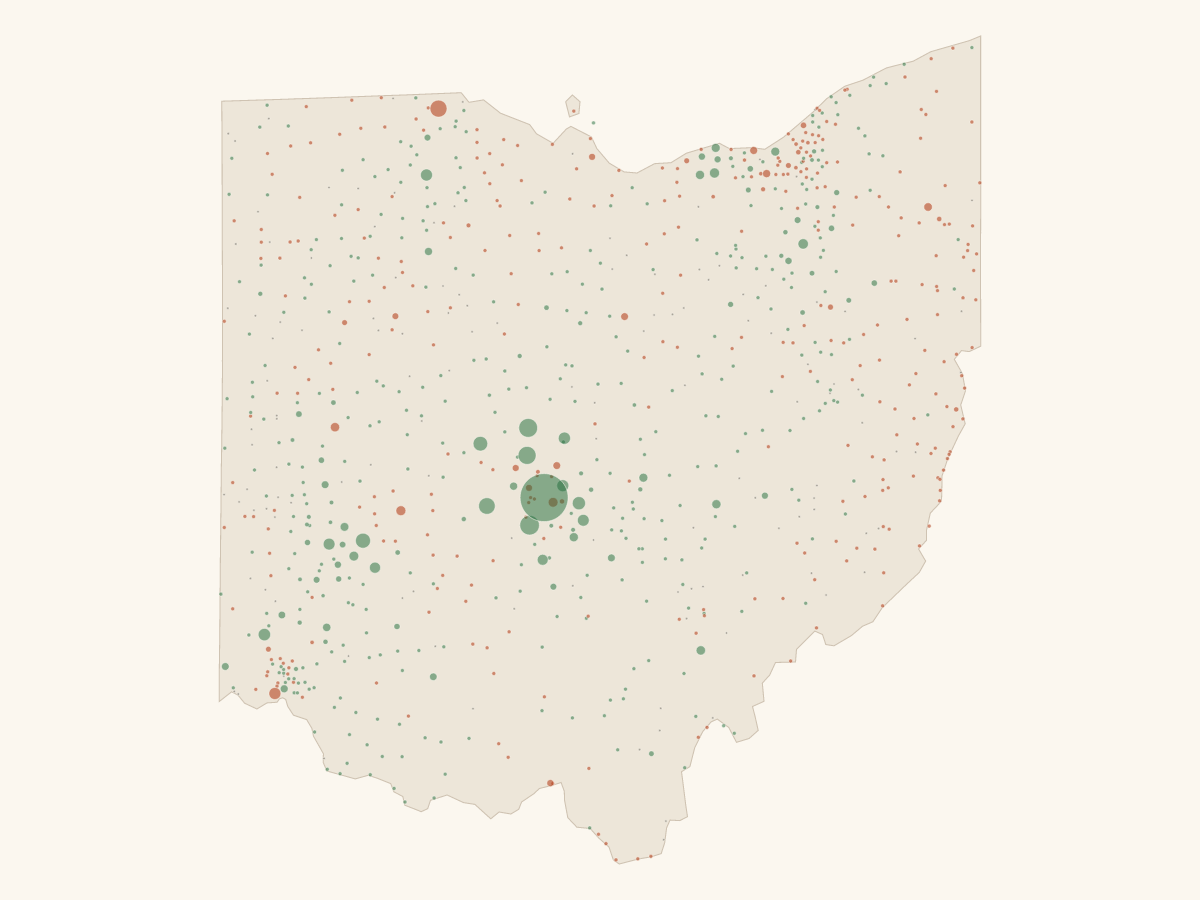
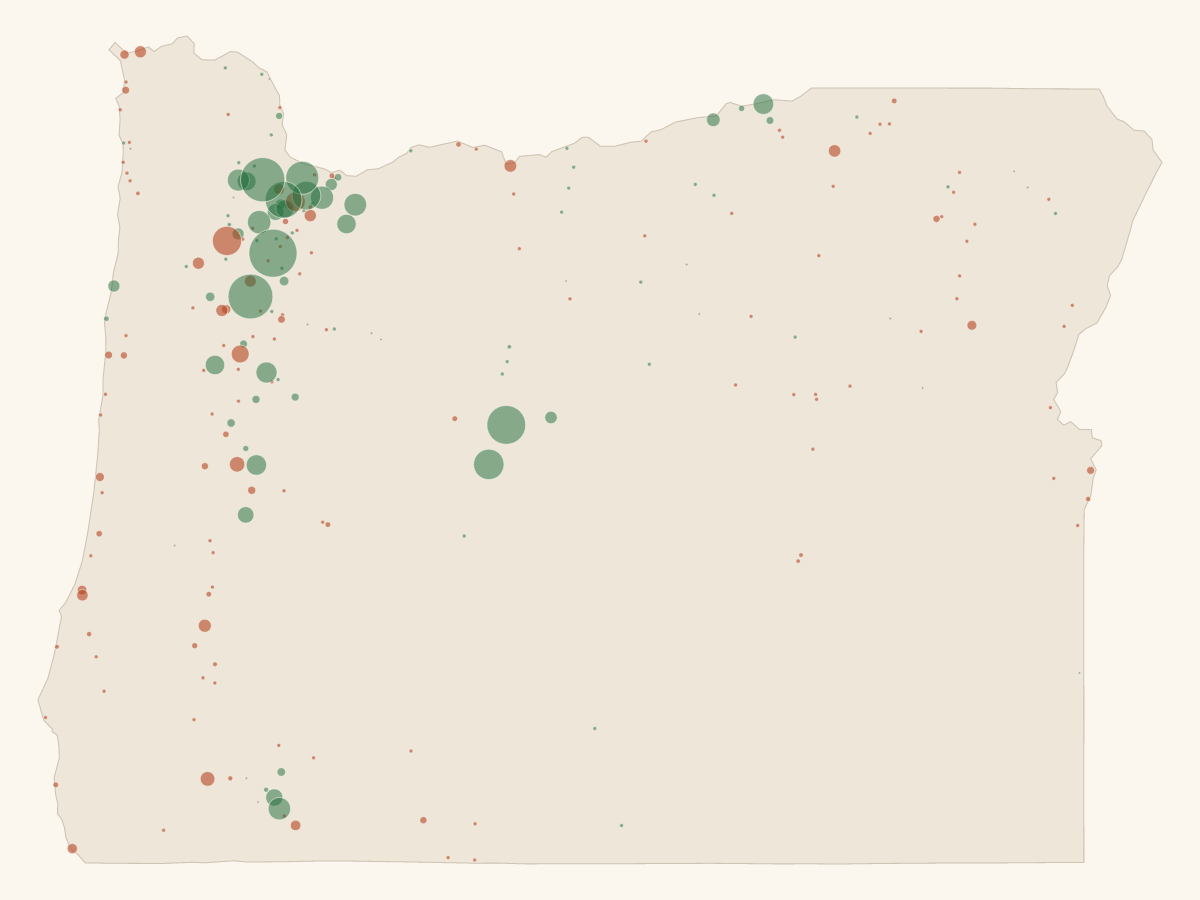
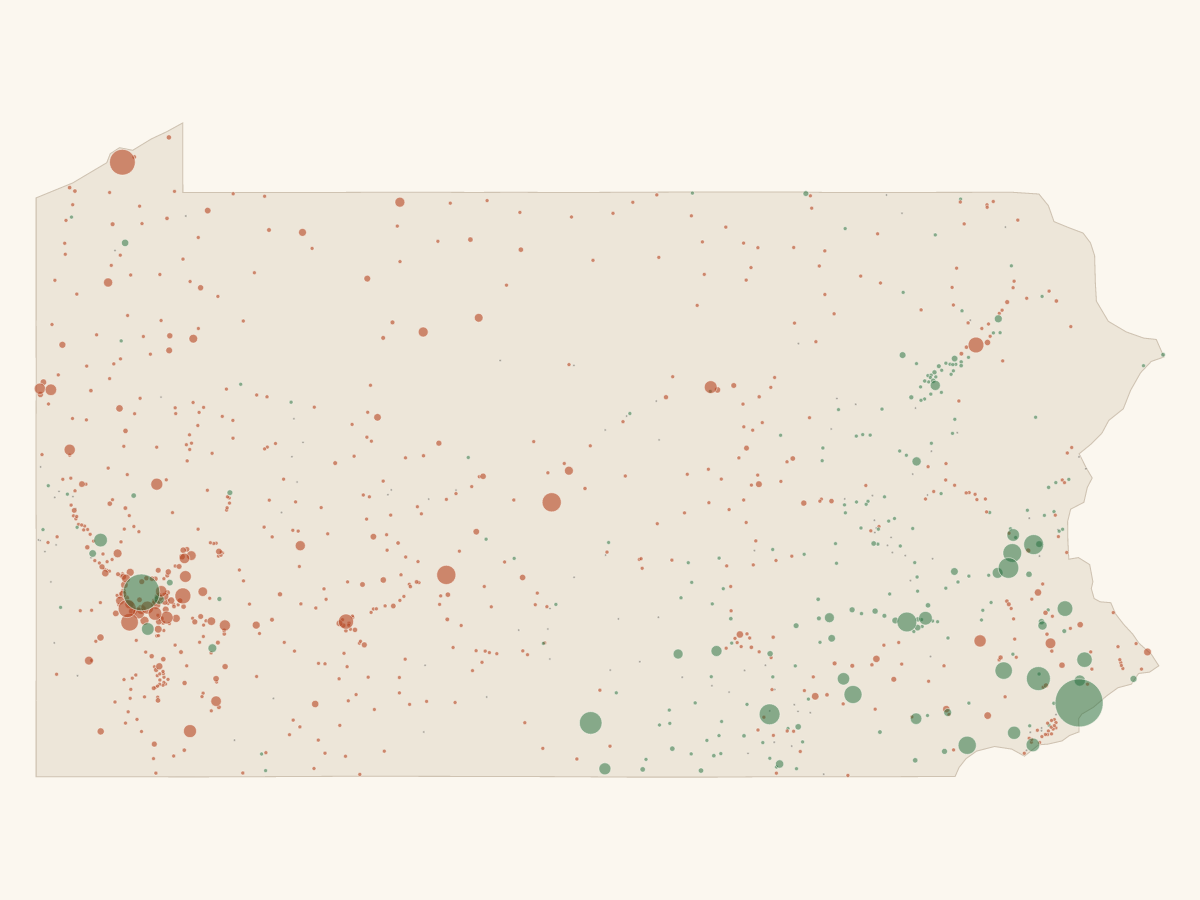
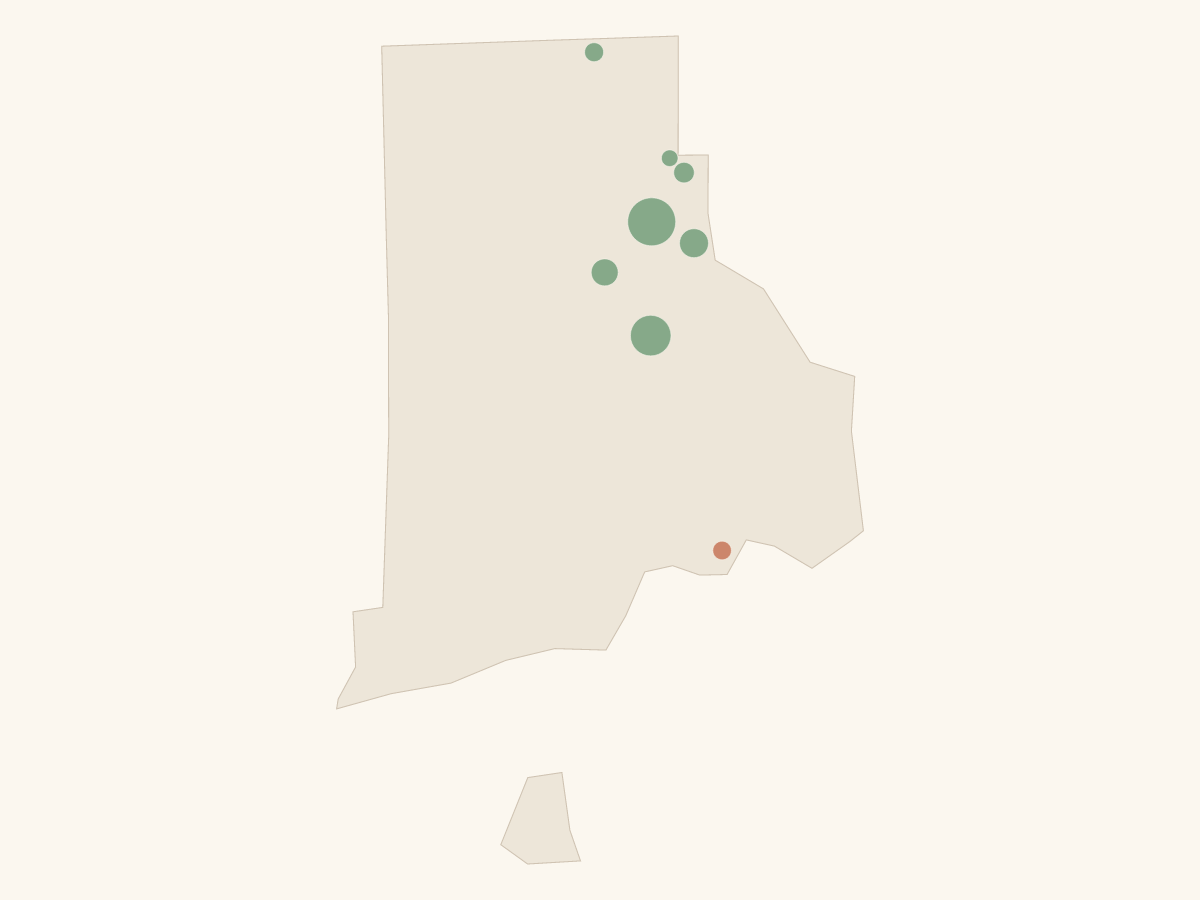
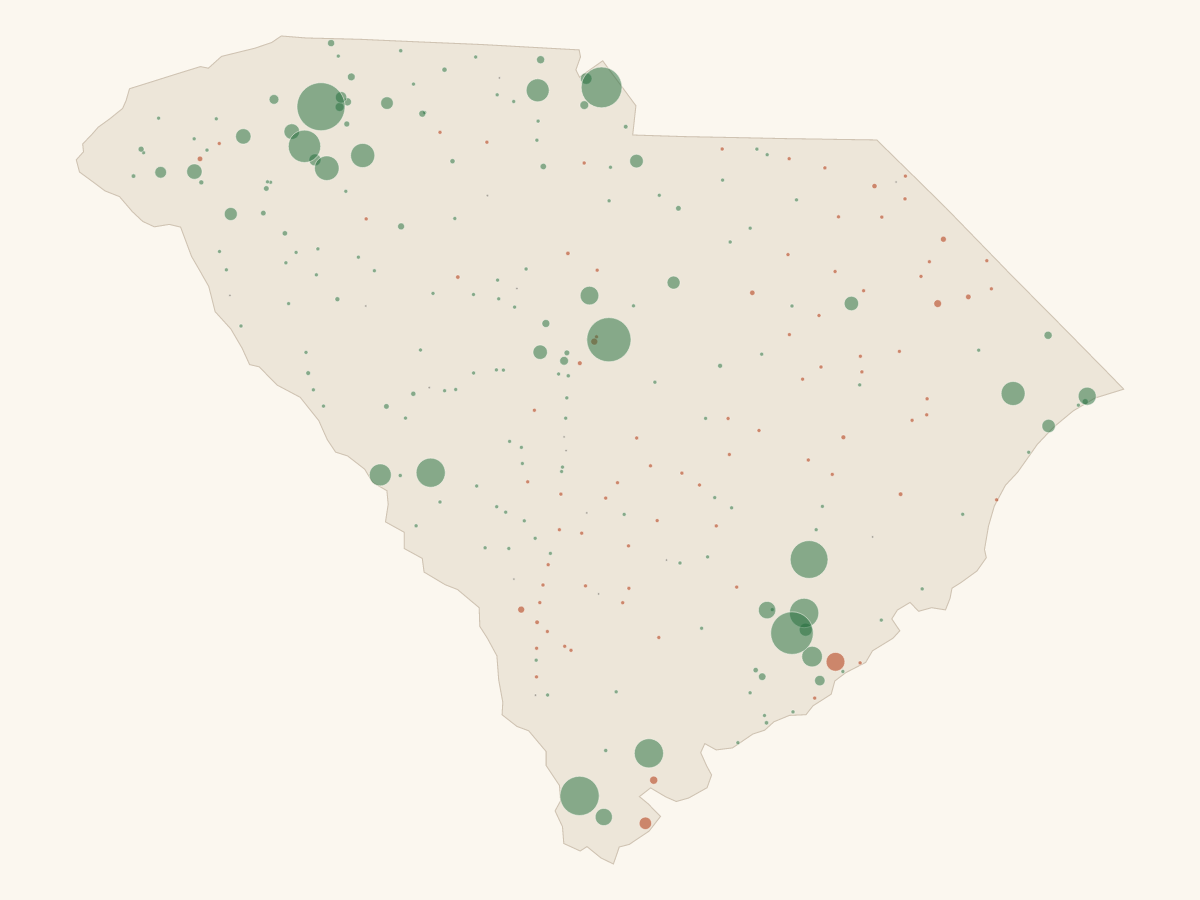
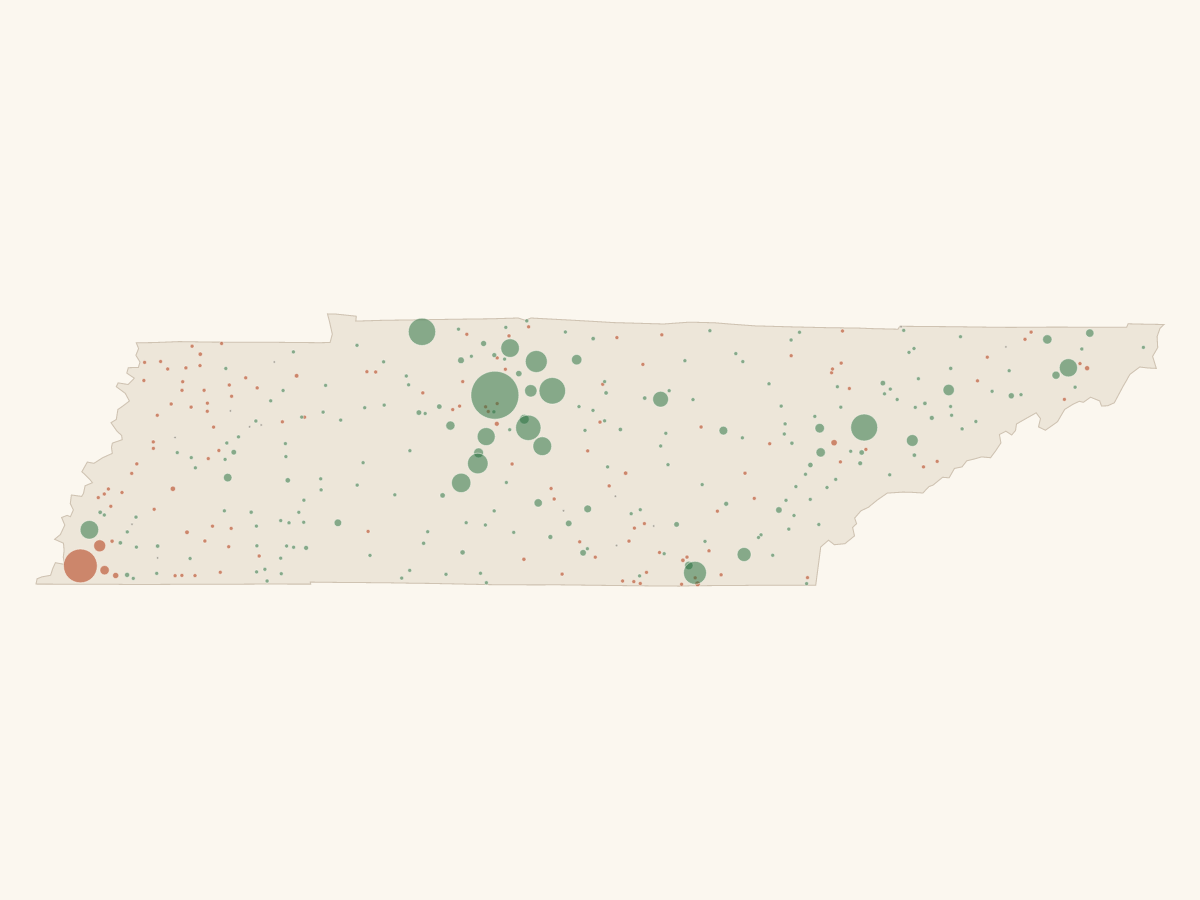
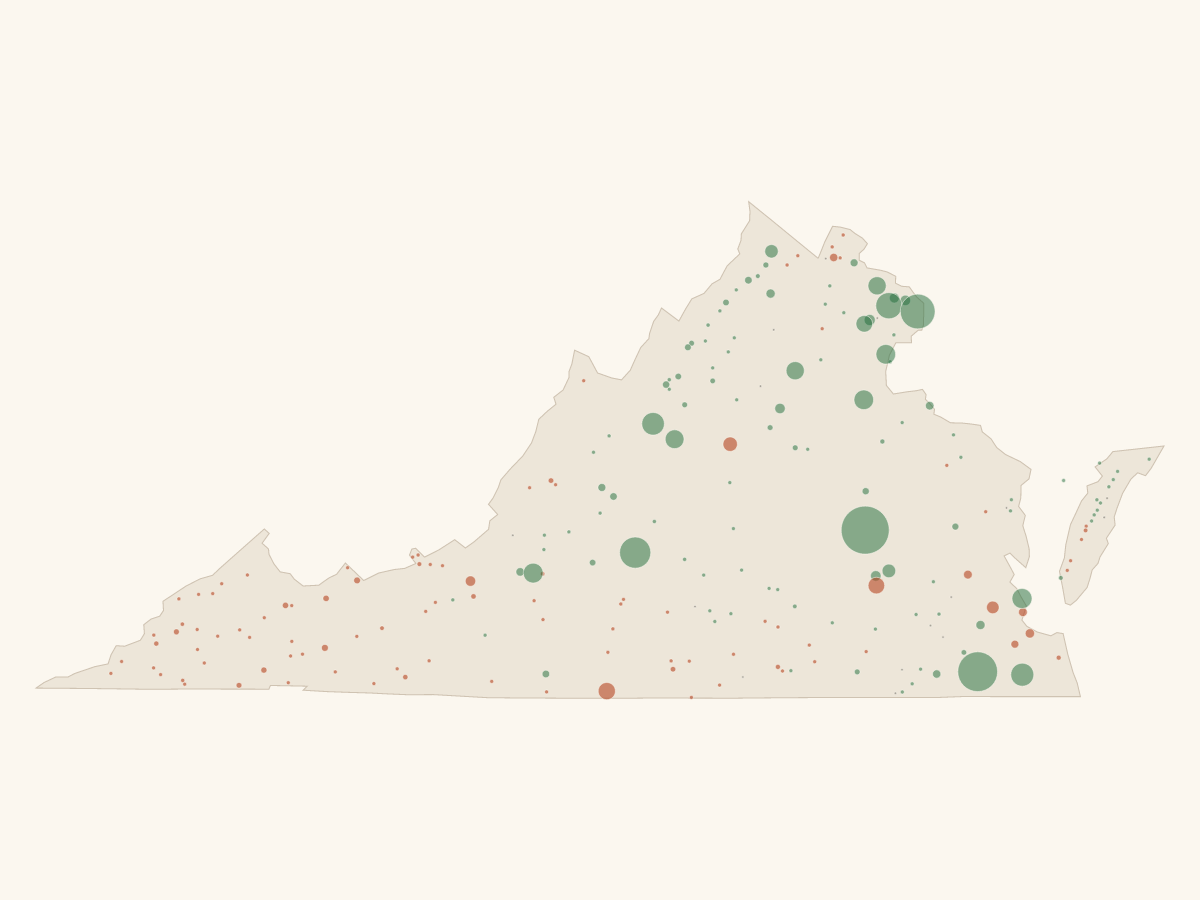
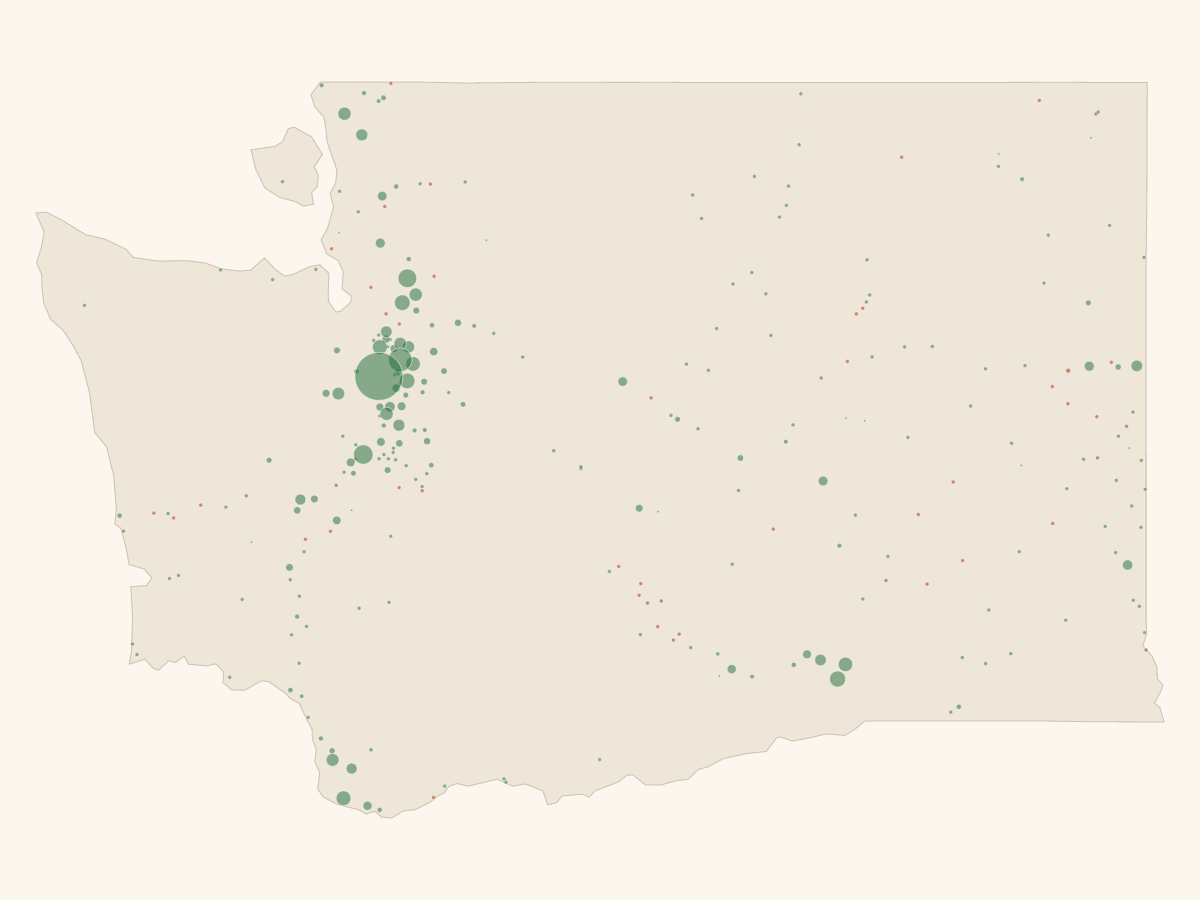
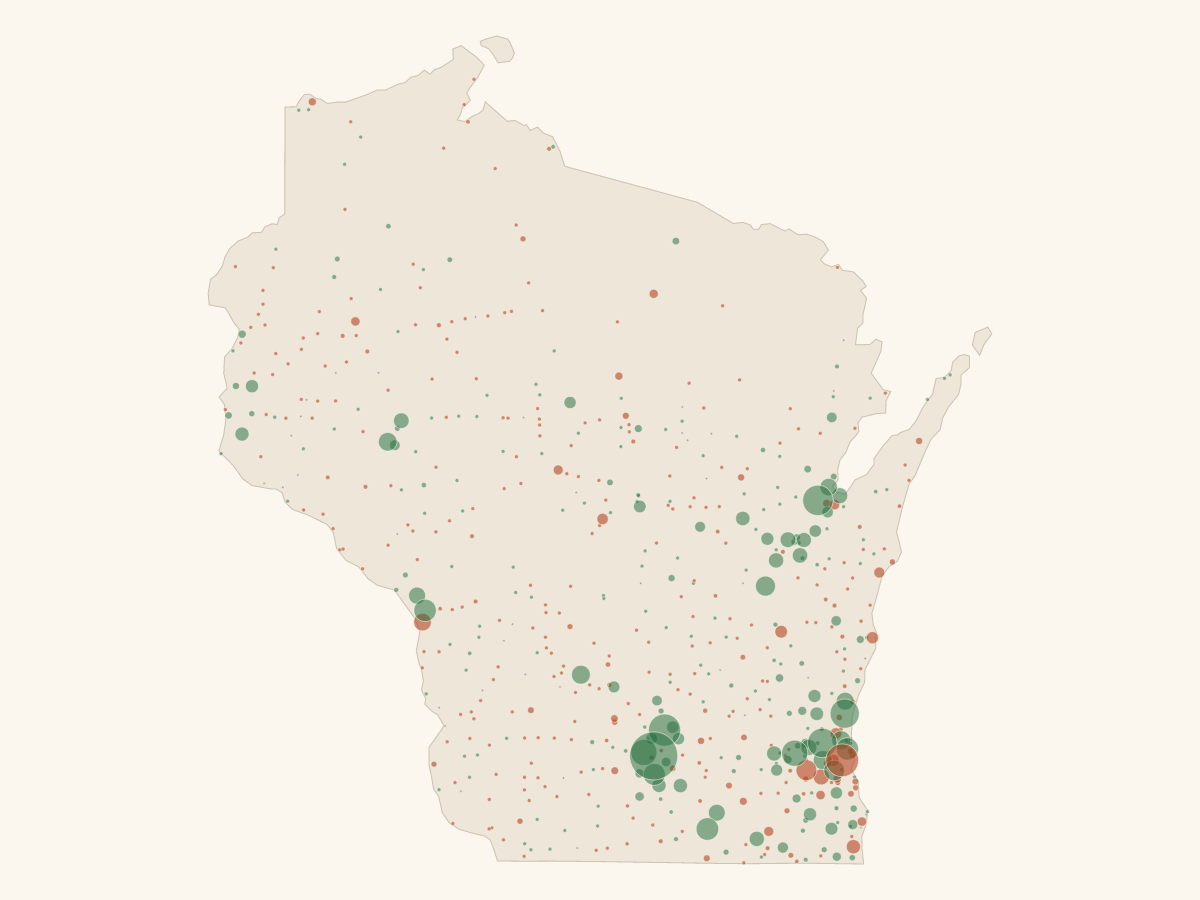
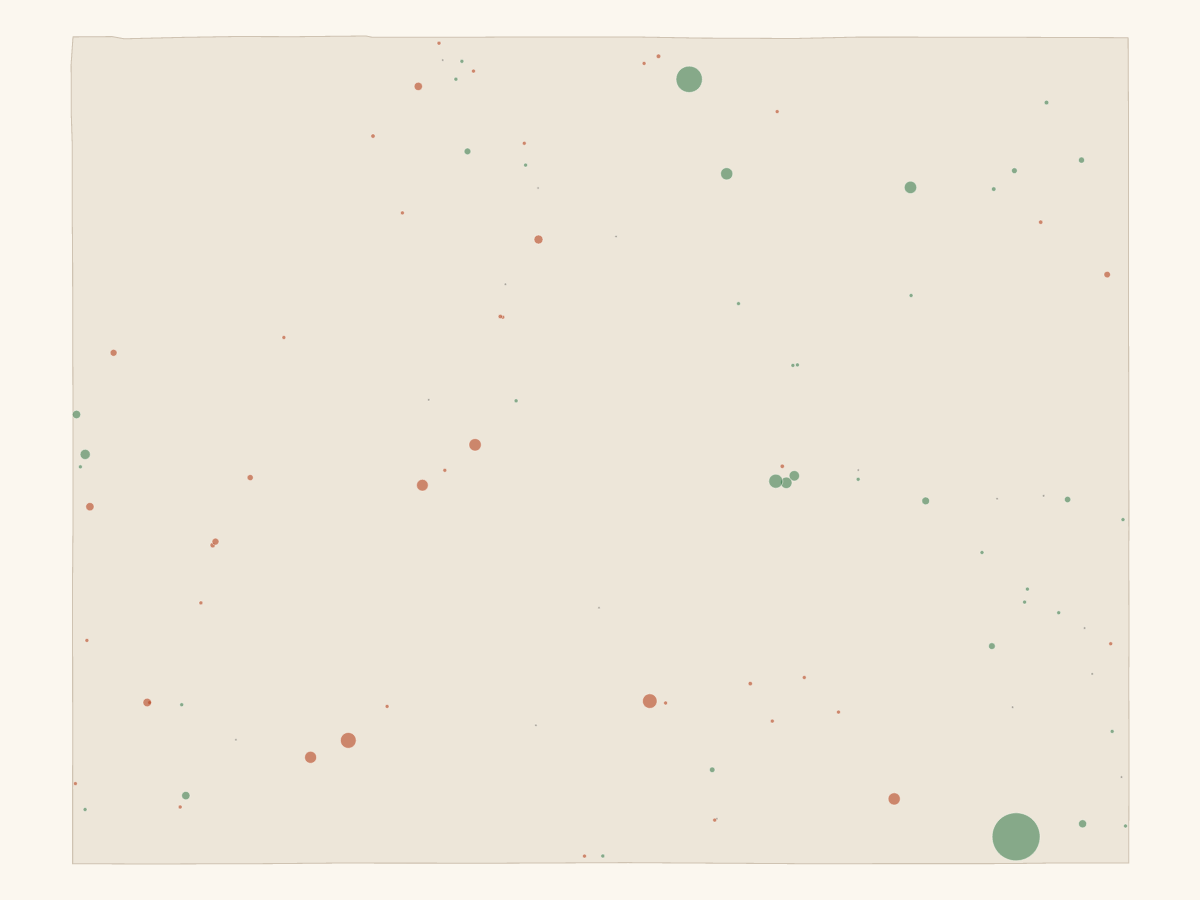
AnnotatedAll-city percentage-change map Every mapped city: color shows direction and circle area shows one-year percent change SVGPNG16:9 cleanContiguous U.S. percentage hero map 16:9 clean crop scaled by percent change, with no labels, legend, Alaska, or Hawaii SVGPNG1200x630Contiguous U.S. percentage social map 1200 by 630 clean crop for social cards and article thumbnails SVGPNG1:1 cleanContiguous U.S. percentage square map Square clean crop for embeds and social variants SVGPNG% gainsPercentage gainers emphasis map Percentage population gains highlighted; flat and declining cities shown as gray context SVGPNG% declinesPercentage declines emphasis map Percentage population declines highlighted; flat and growing cities shown as gray context SVGPNG5%+ movesLarge percentage moves map Only cities that gained or lost at least 5% from 2024 to 2025 SVGPNG
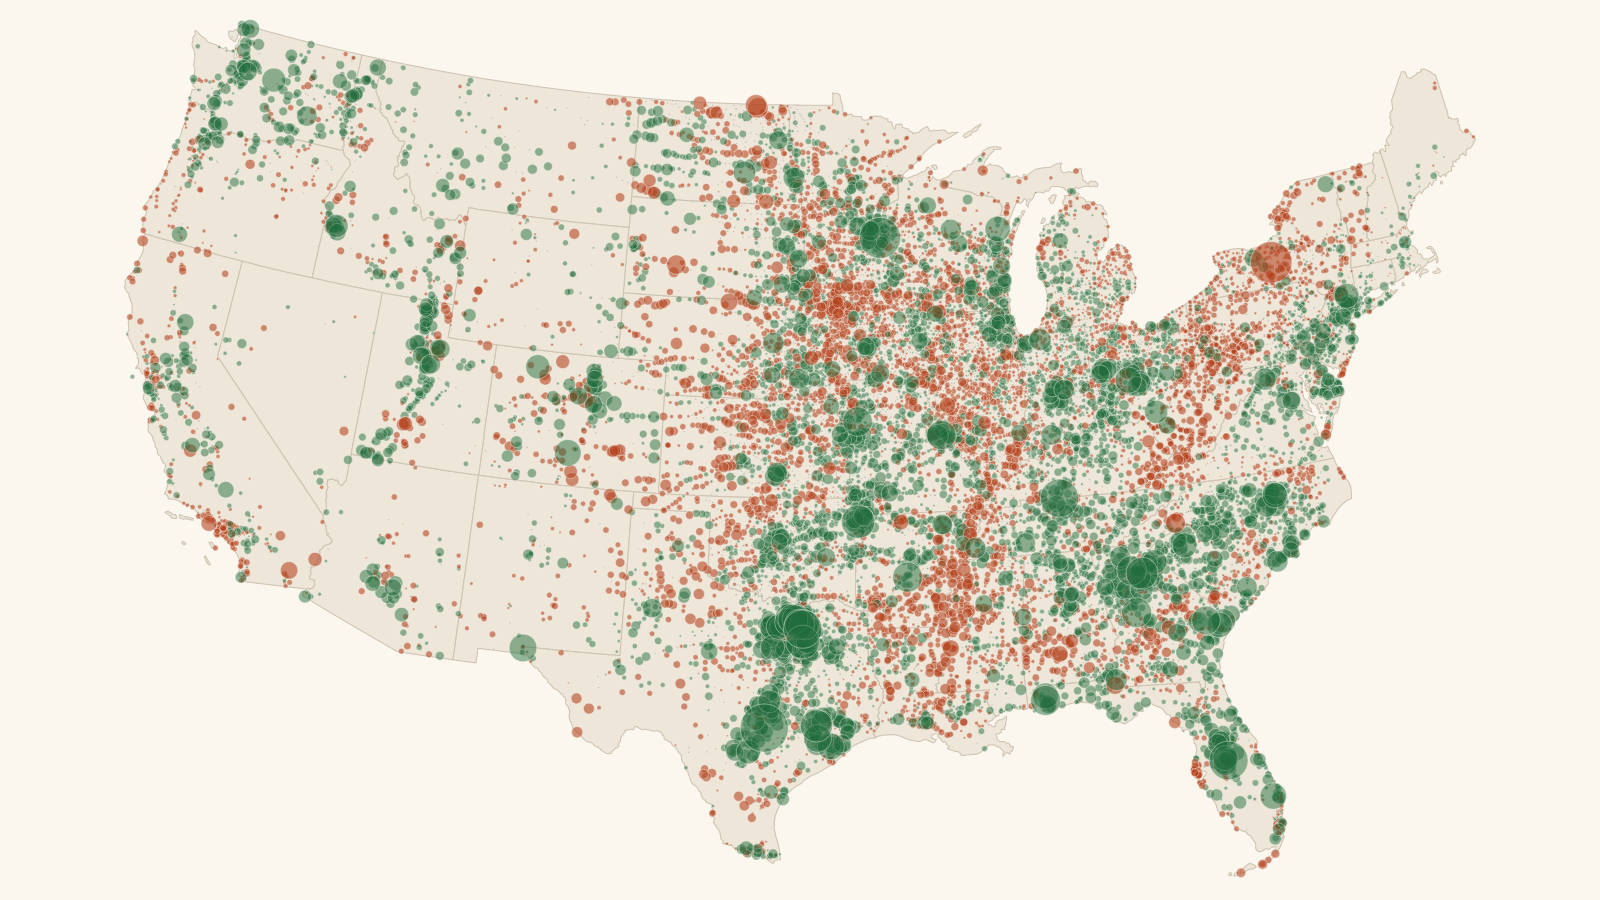
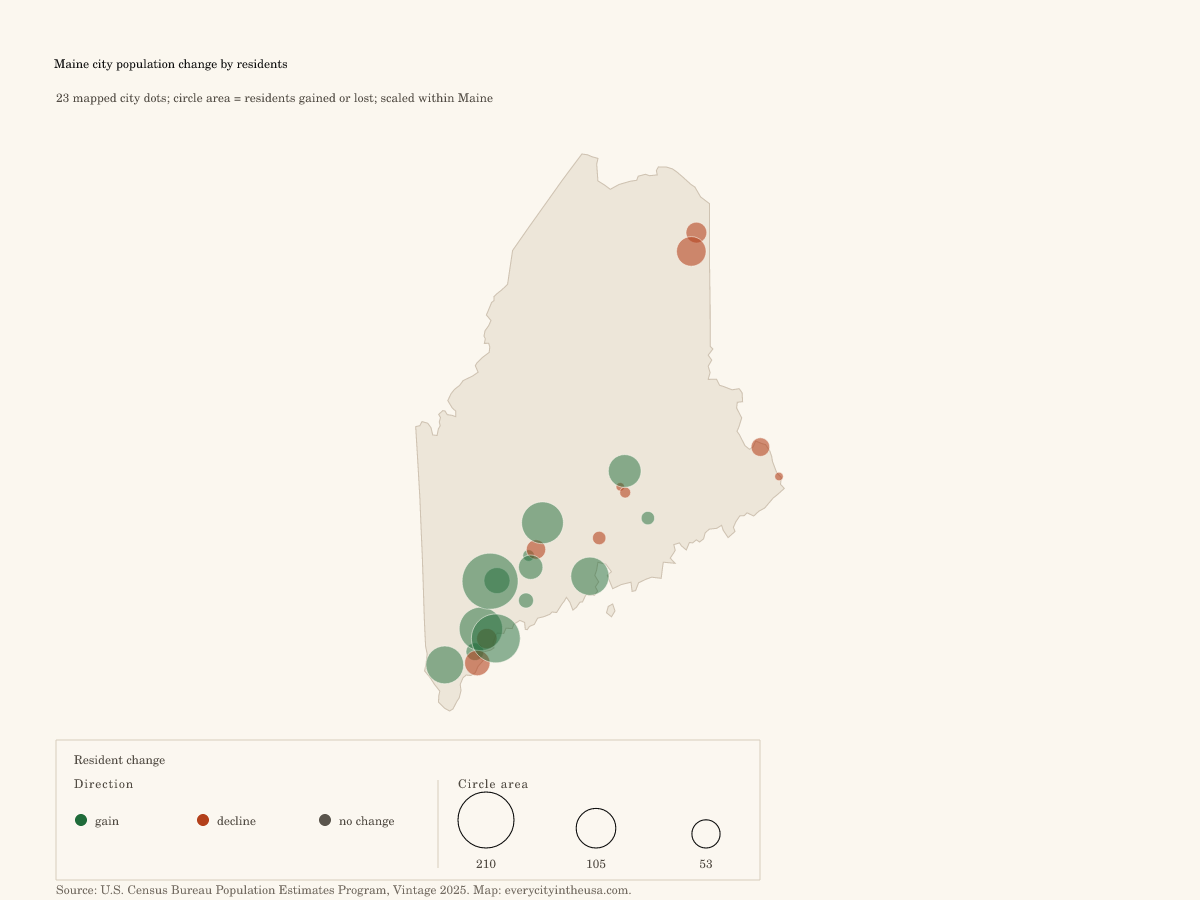
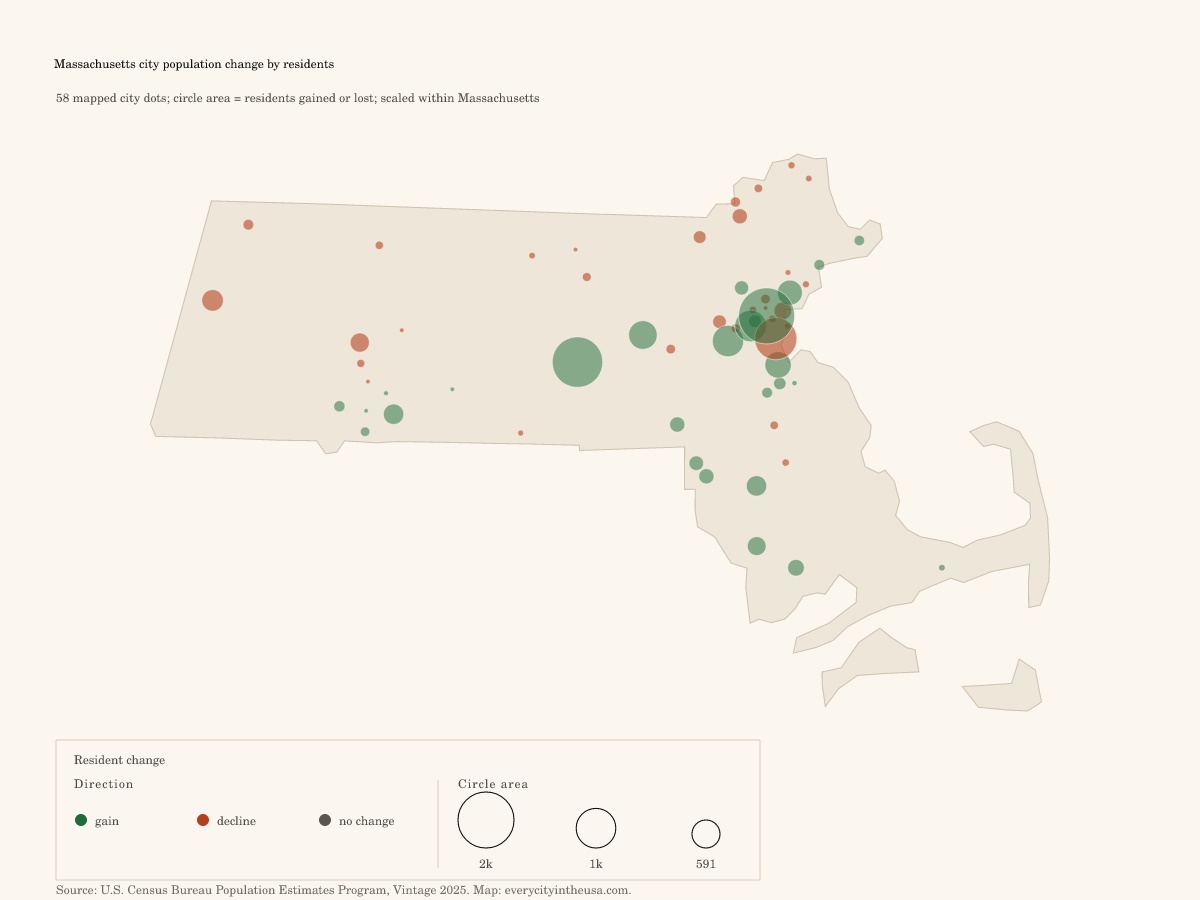
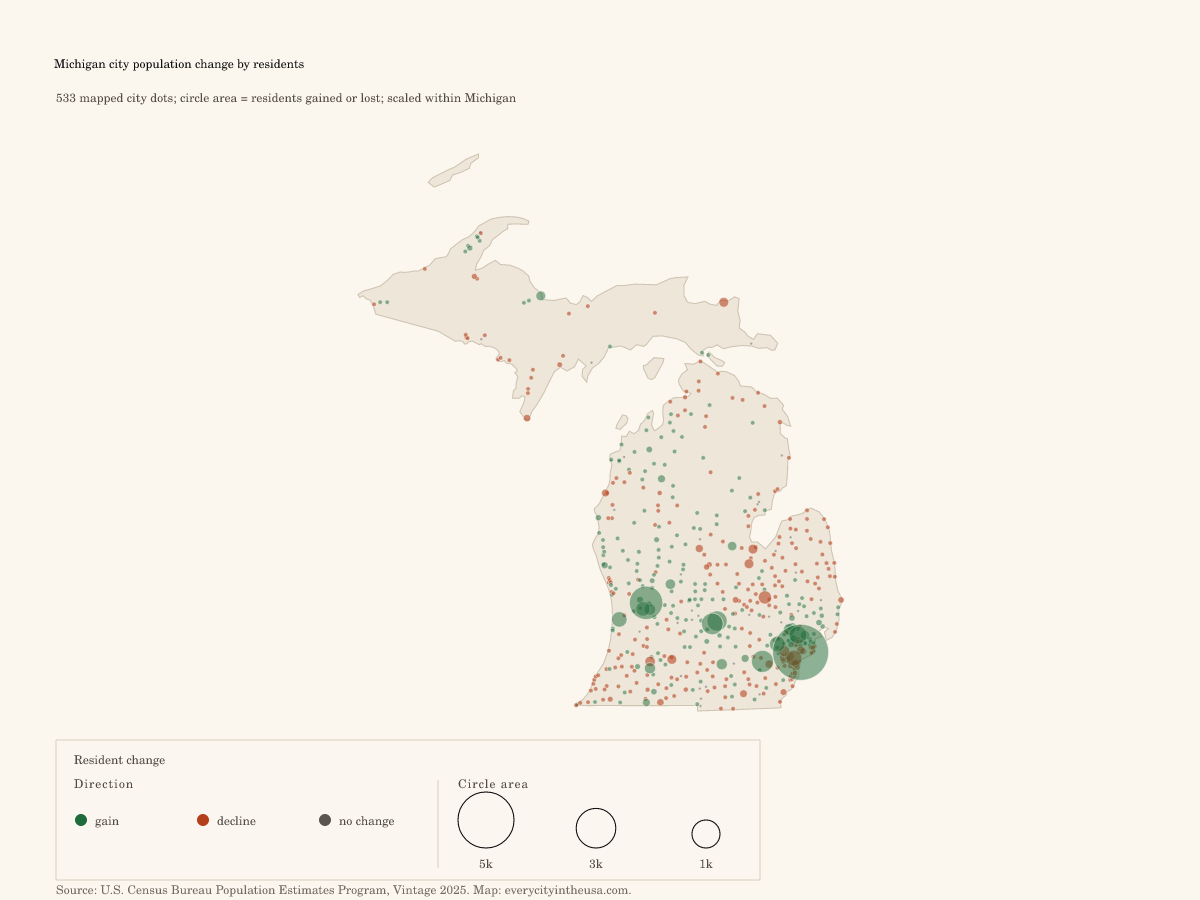
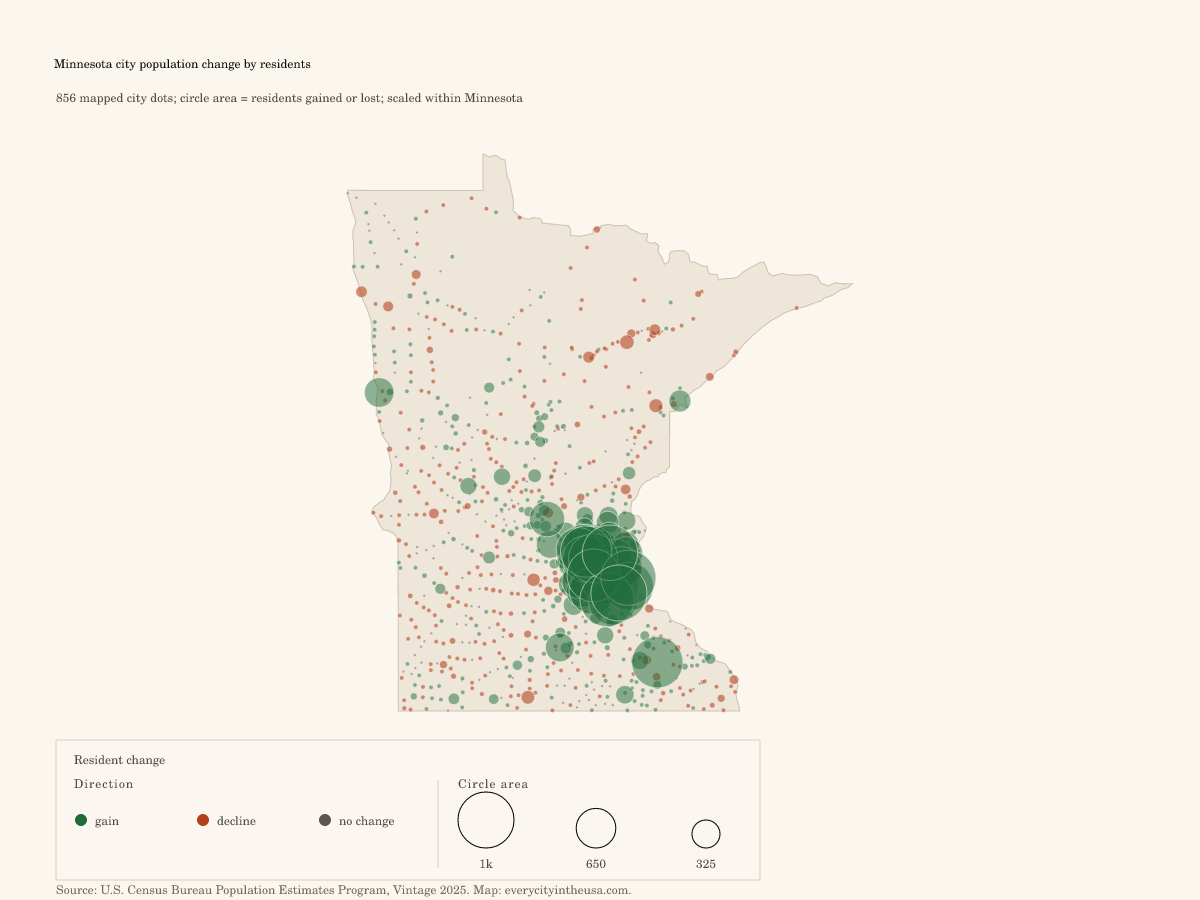
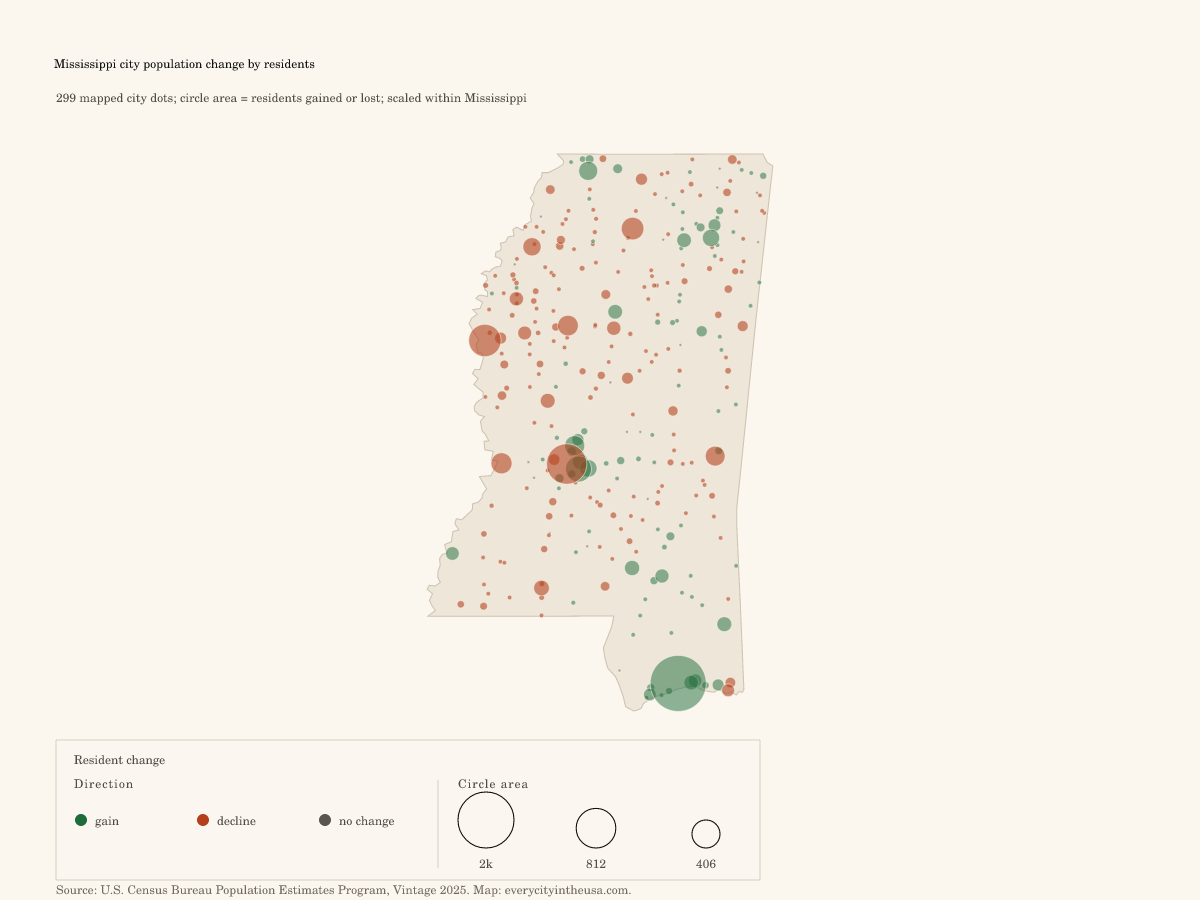
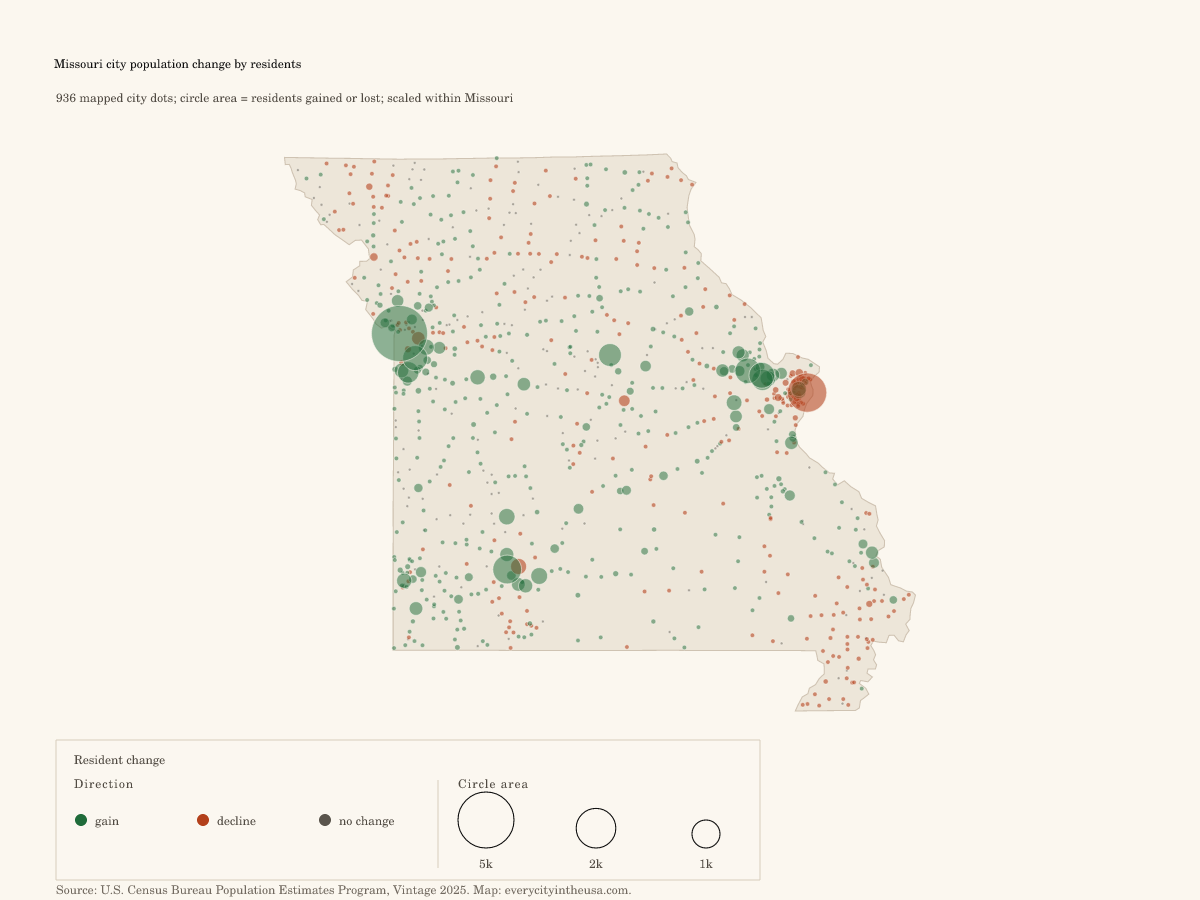
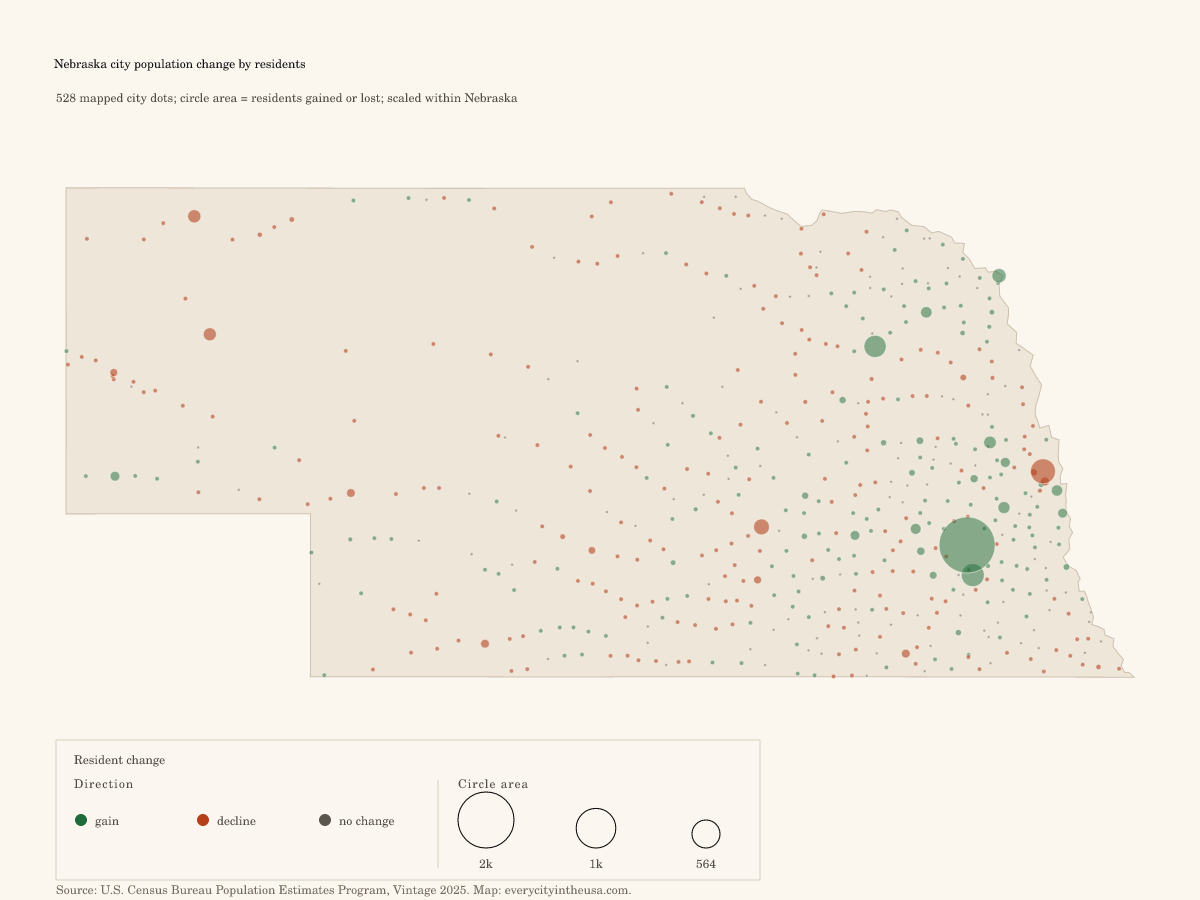
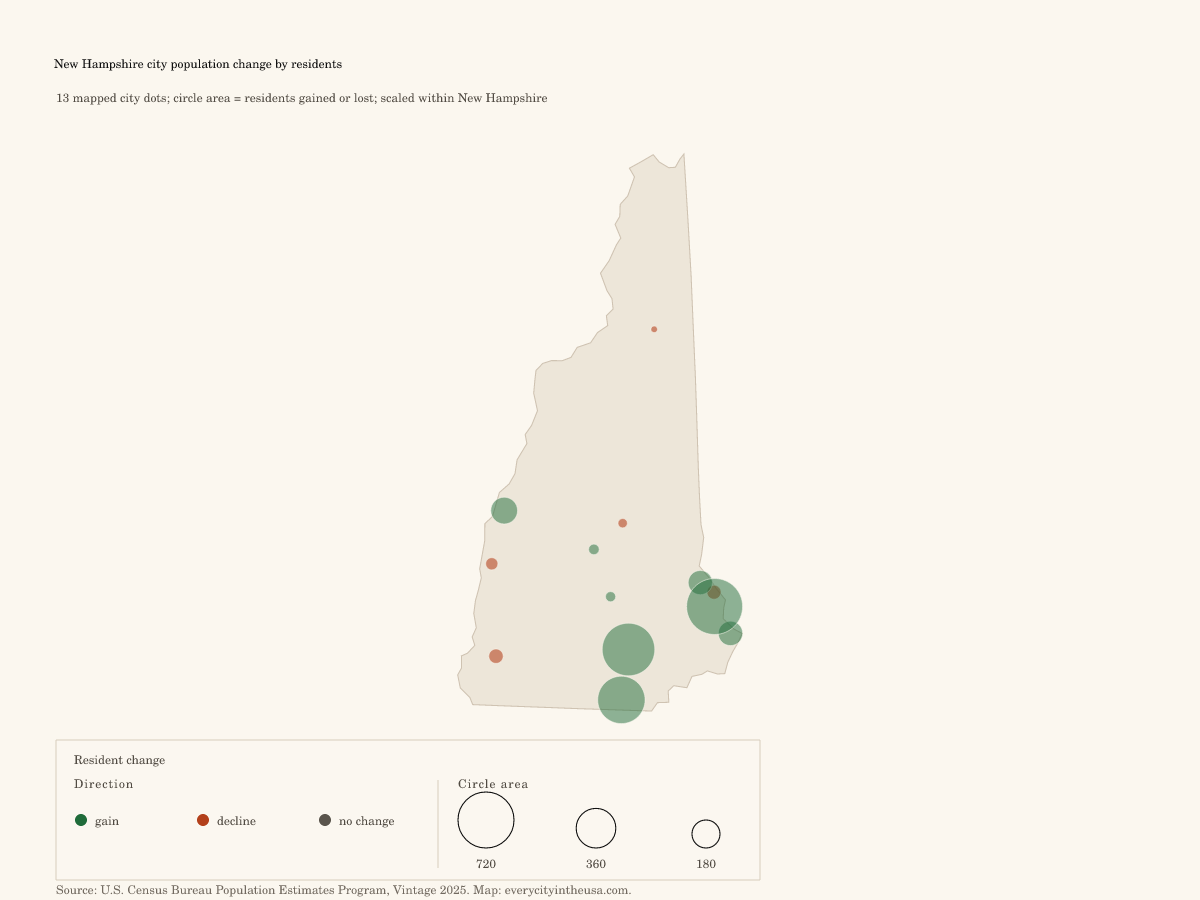
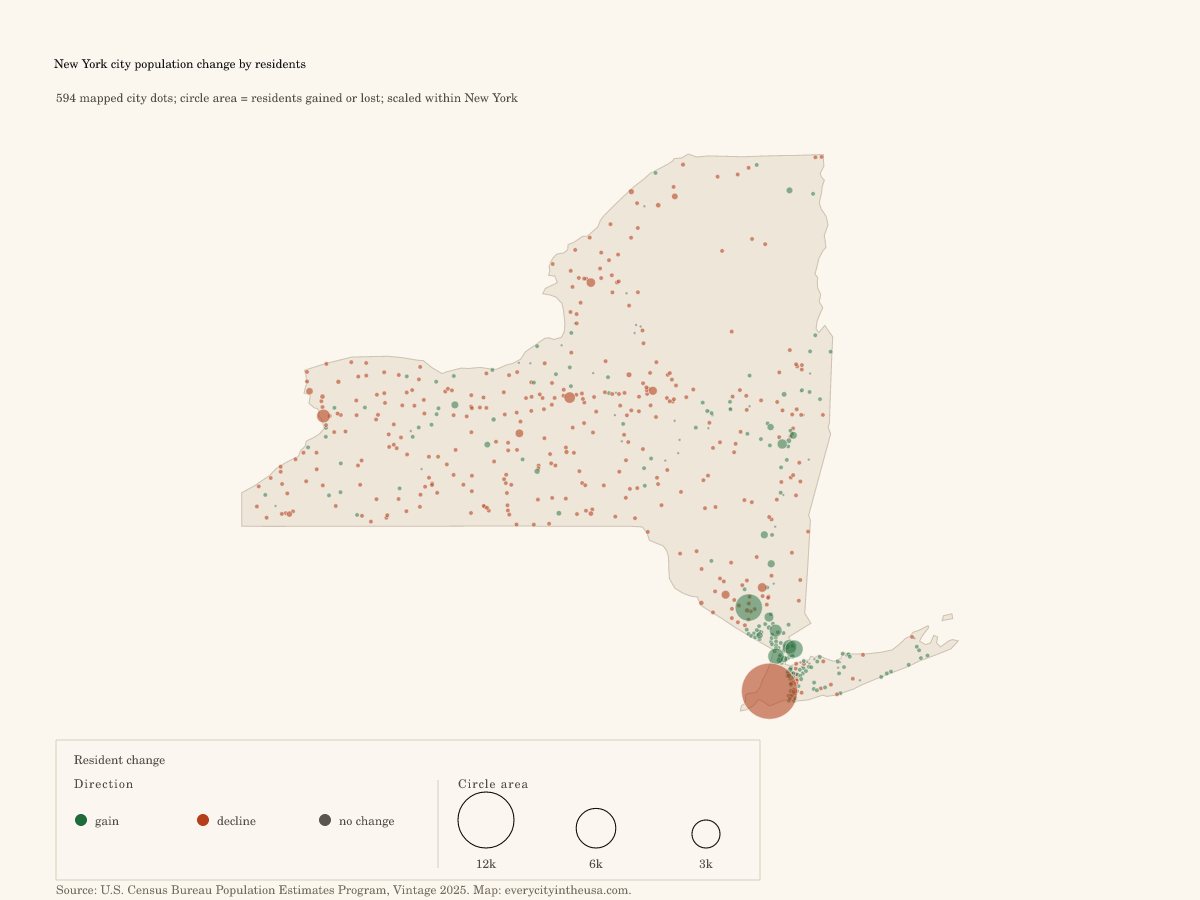
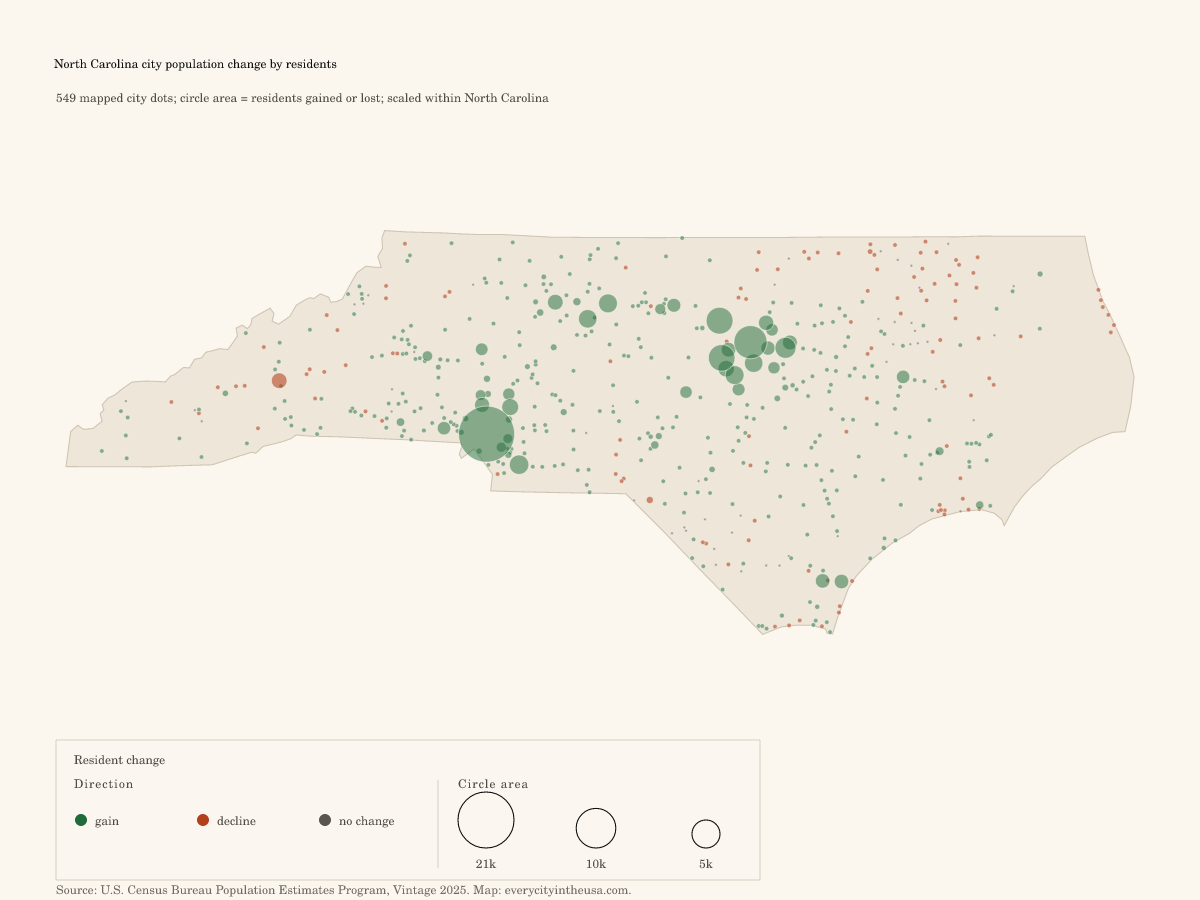
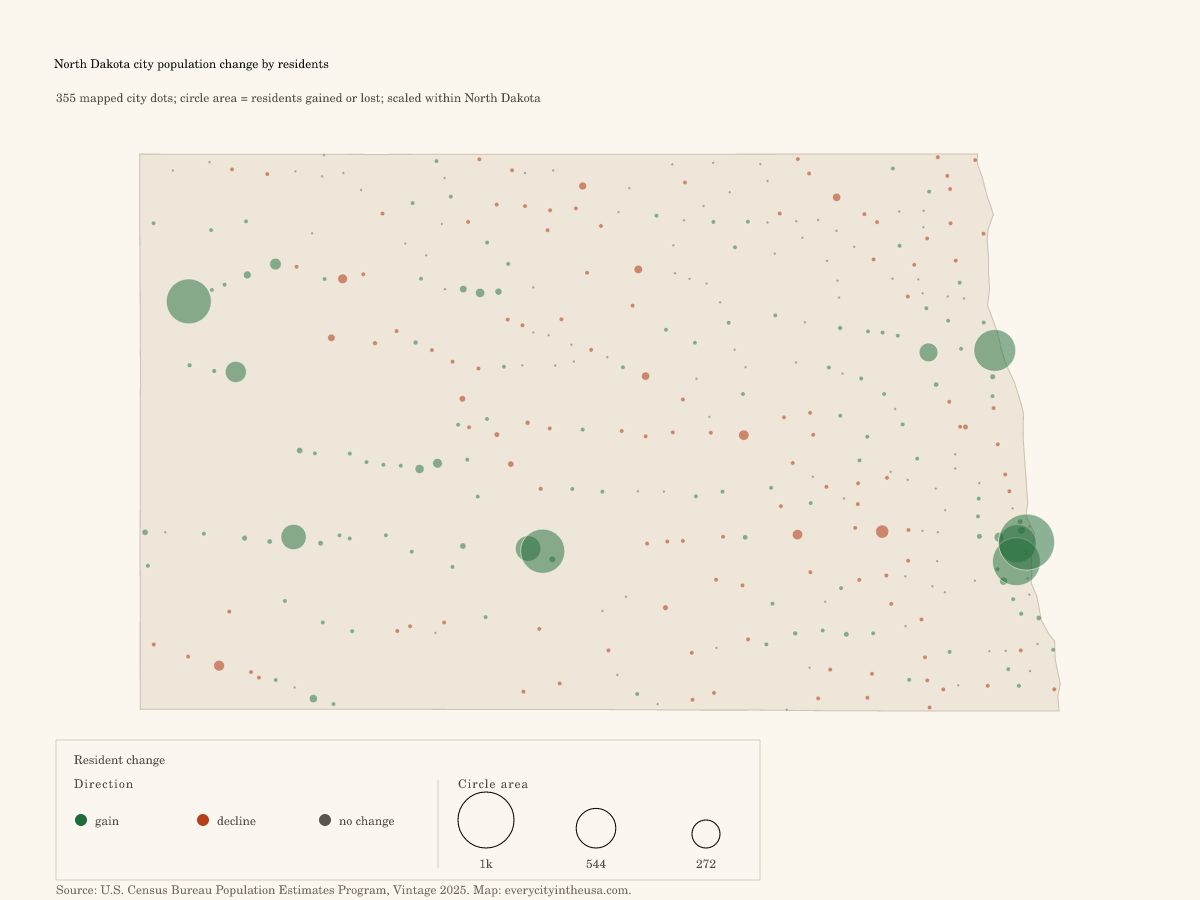
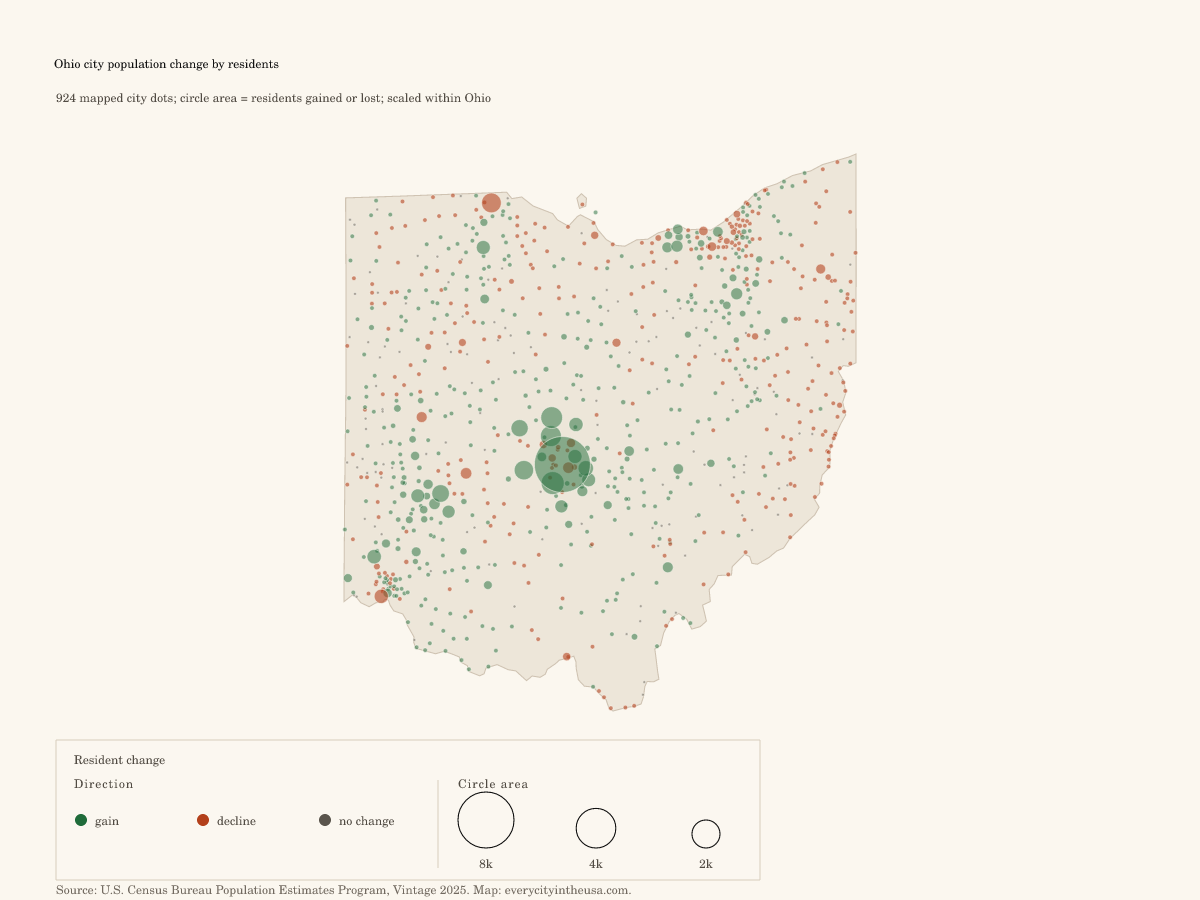
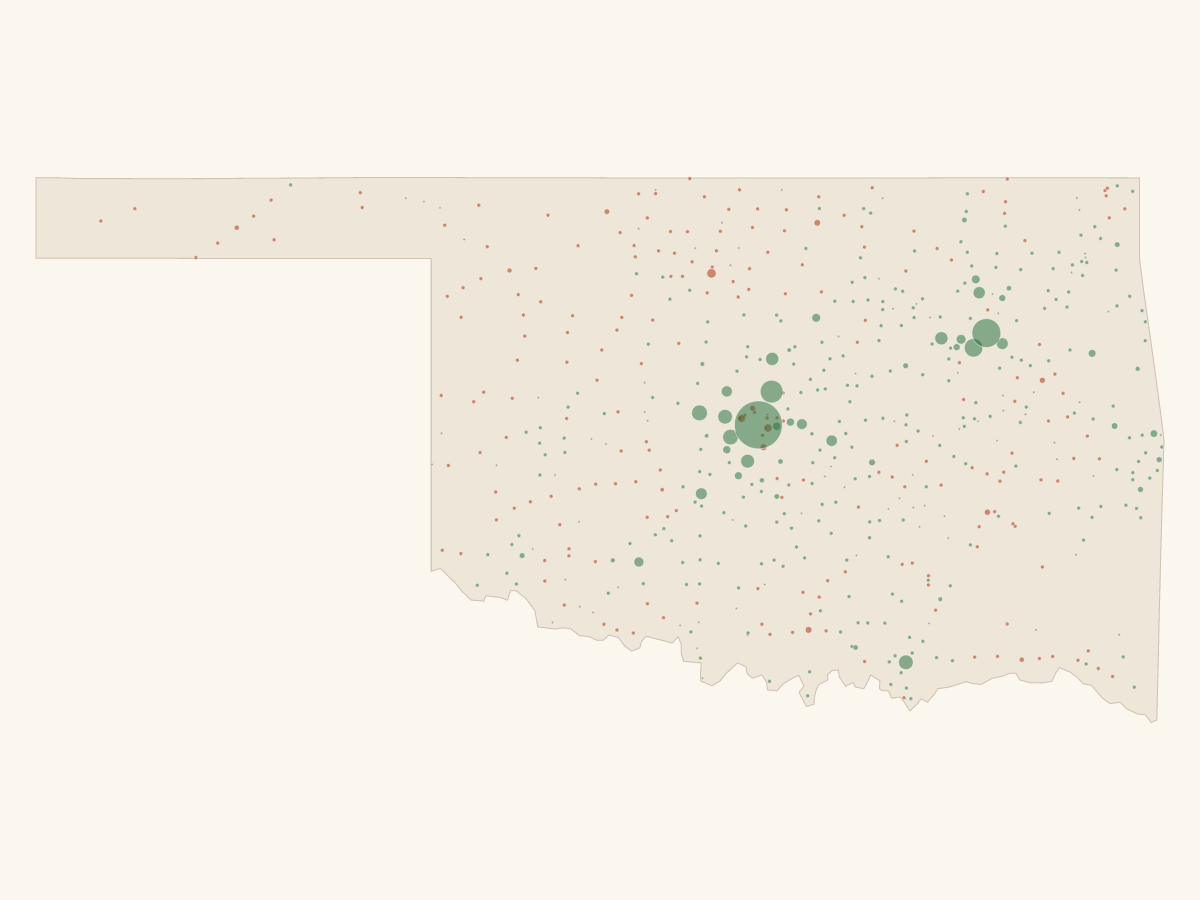
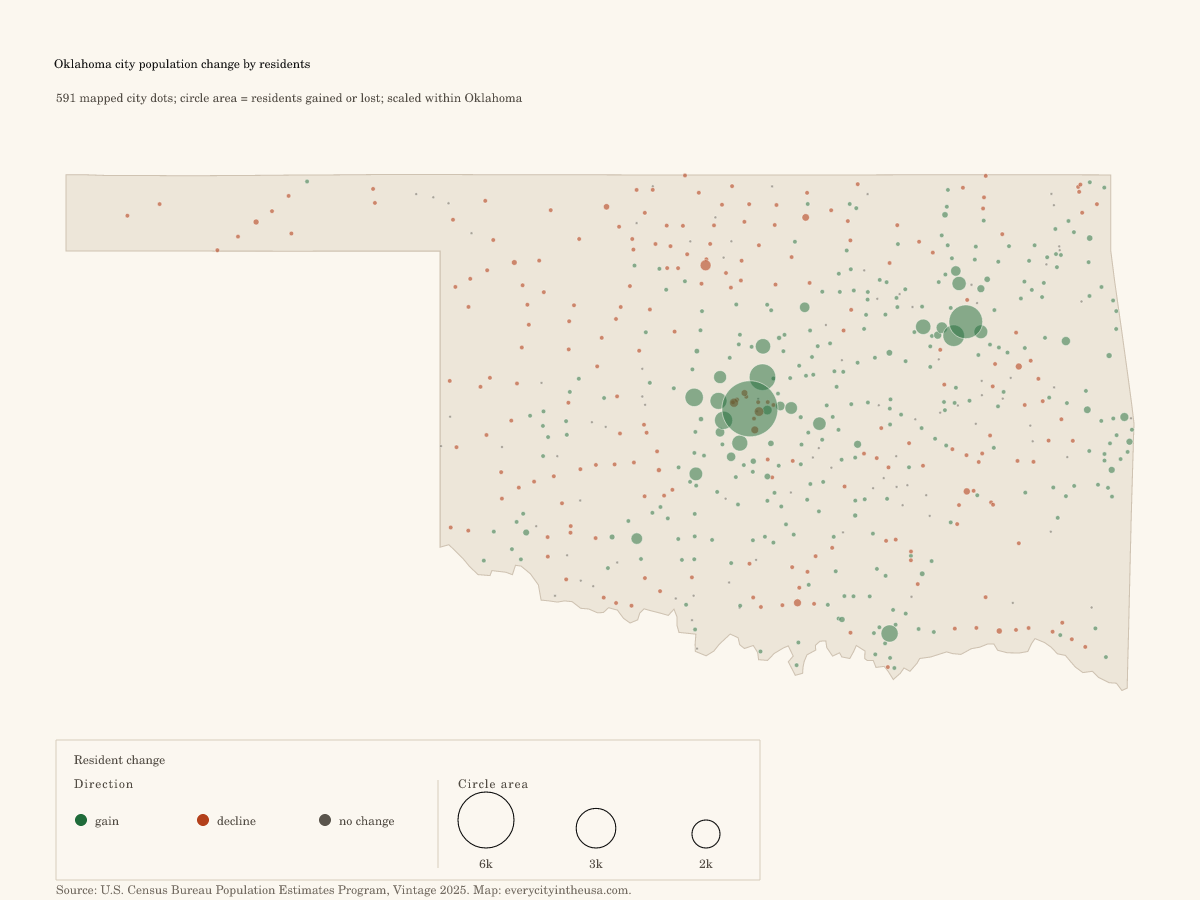
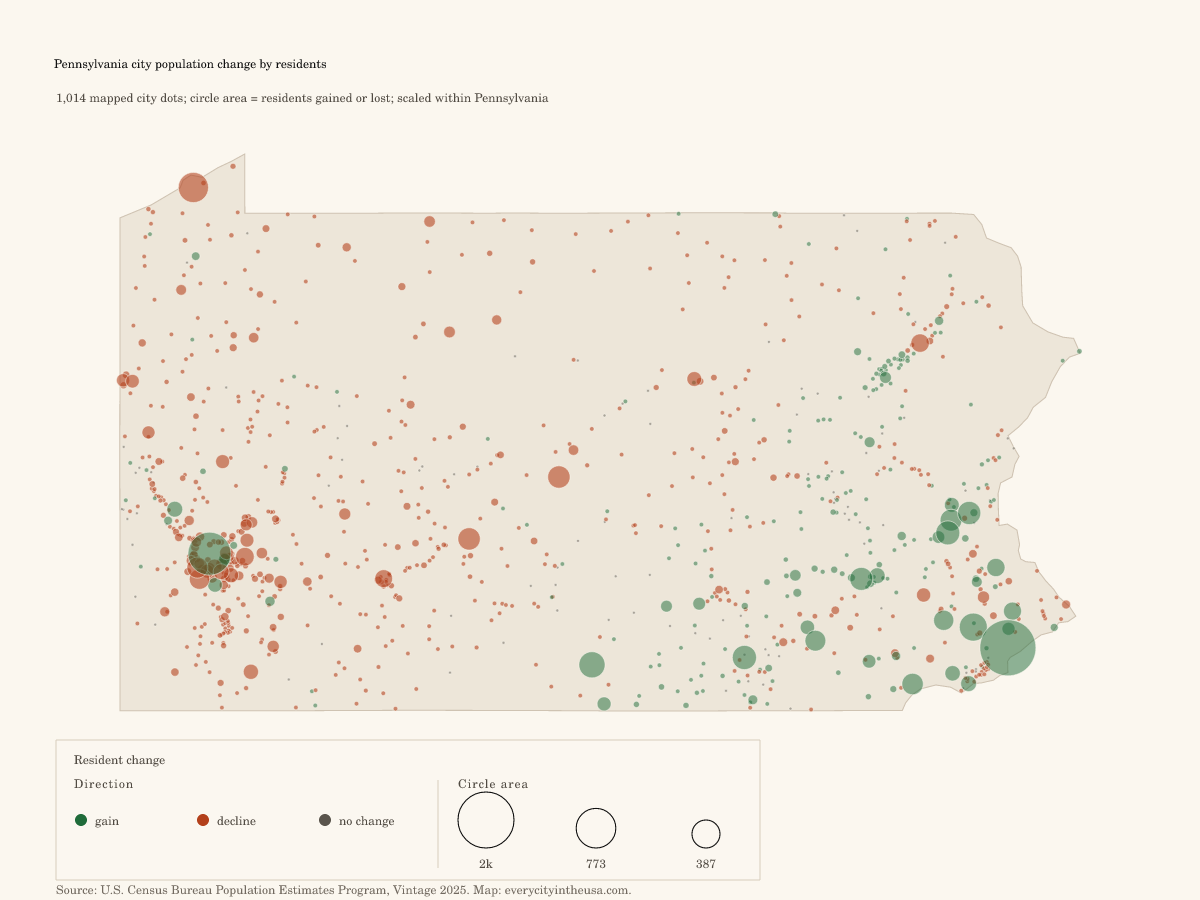
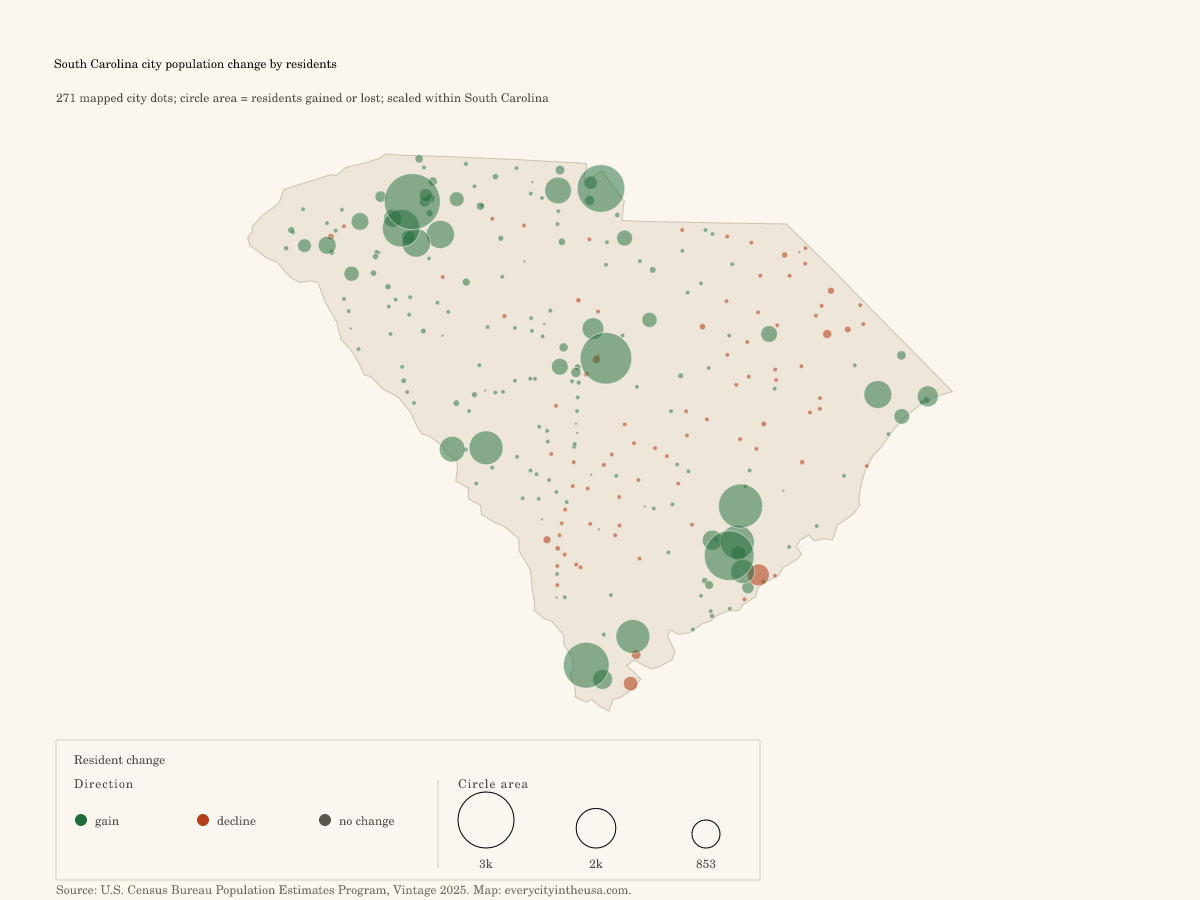
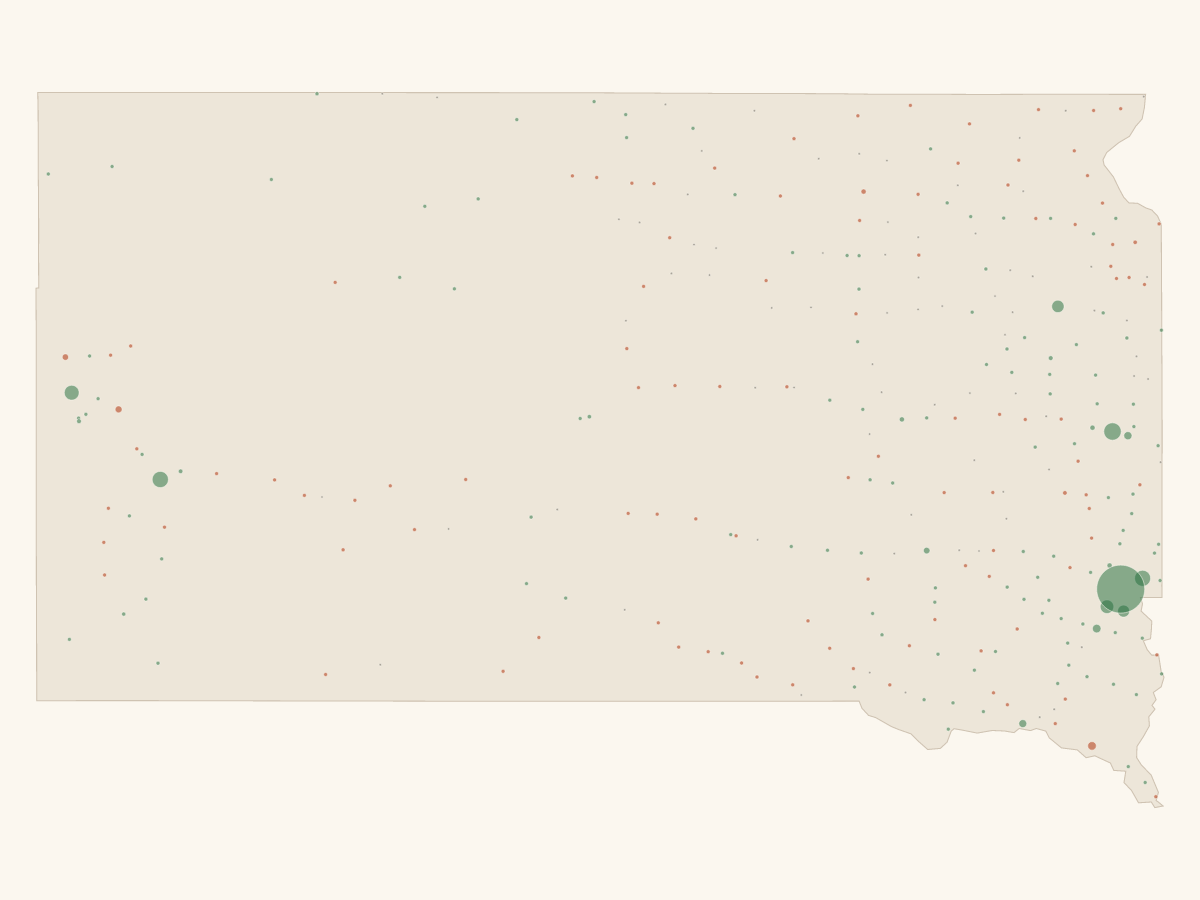
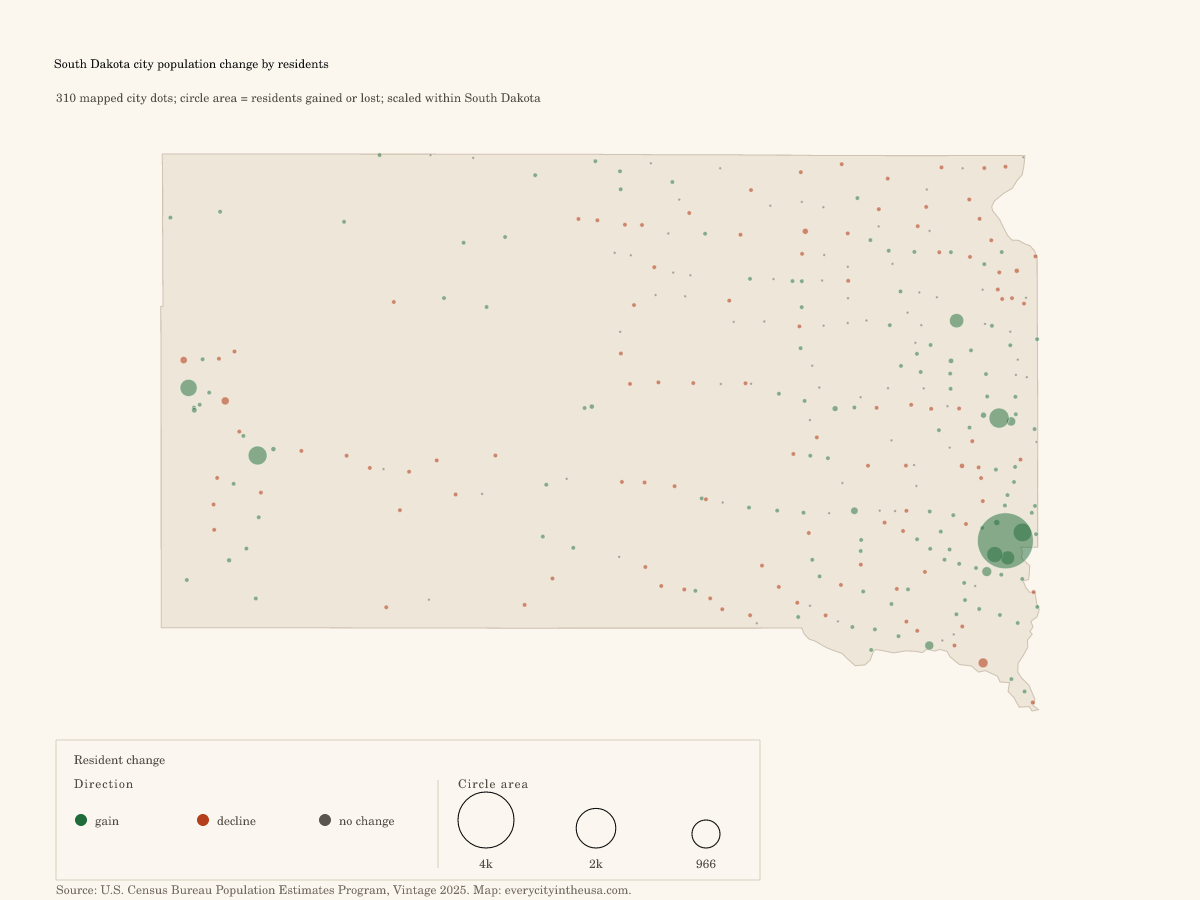
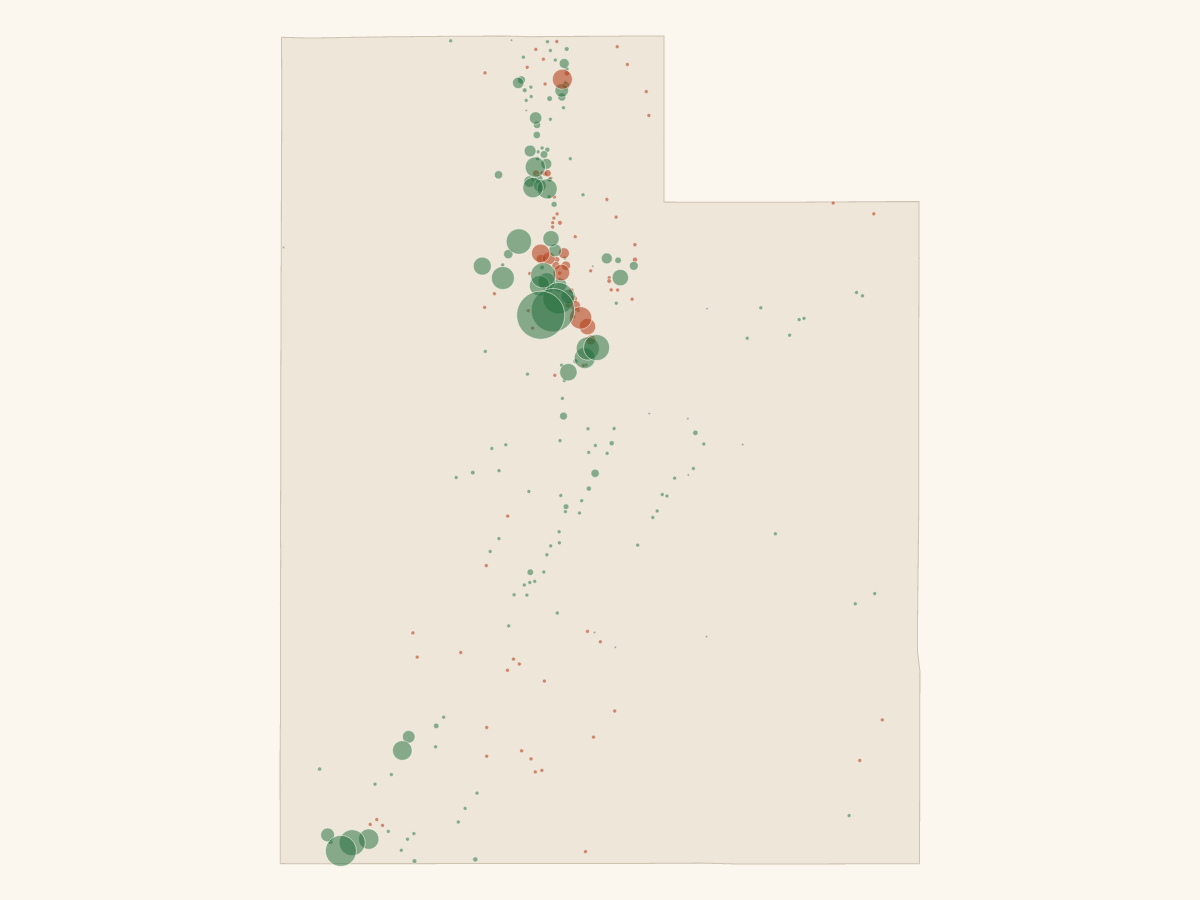
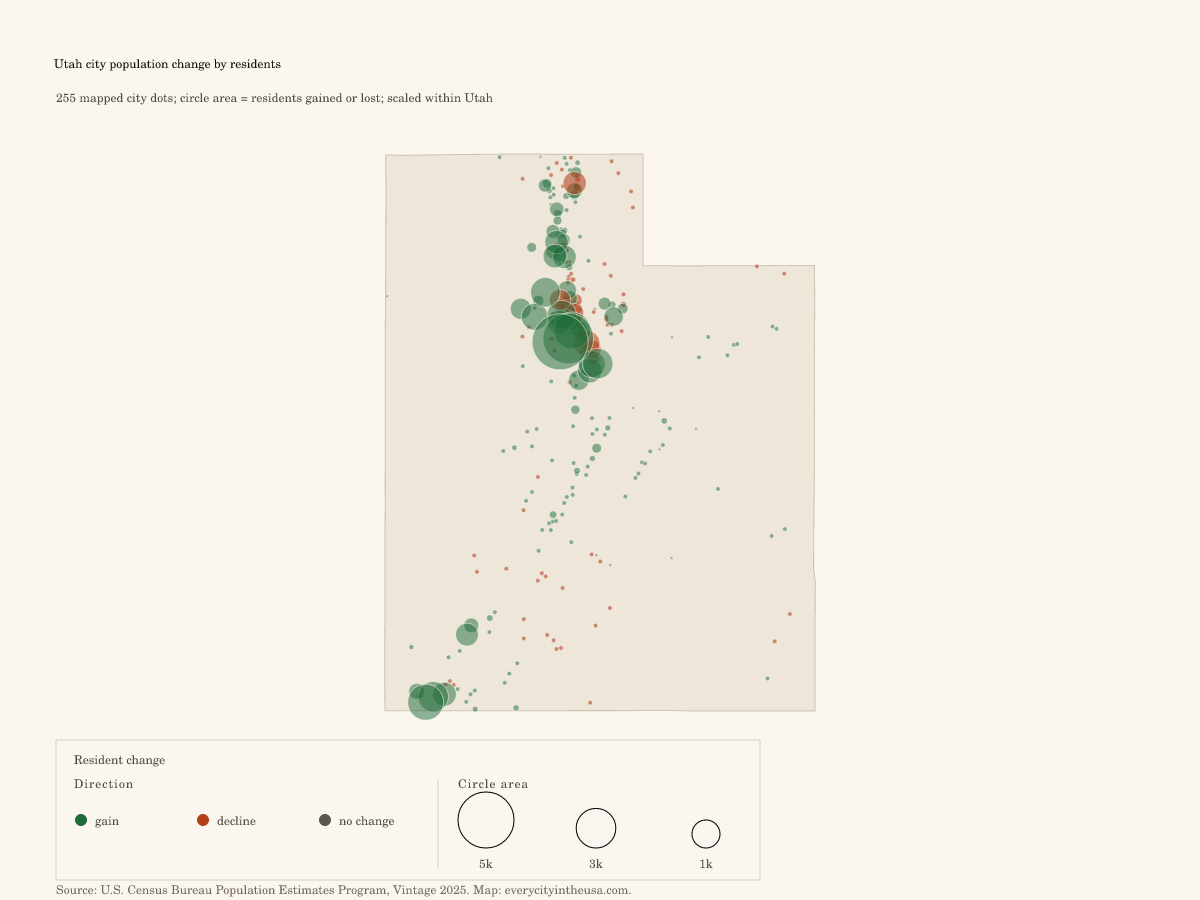
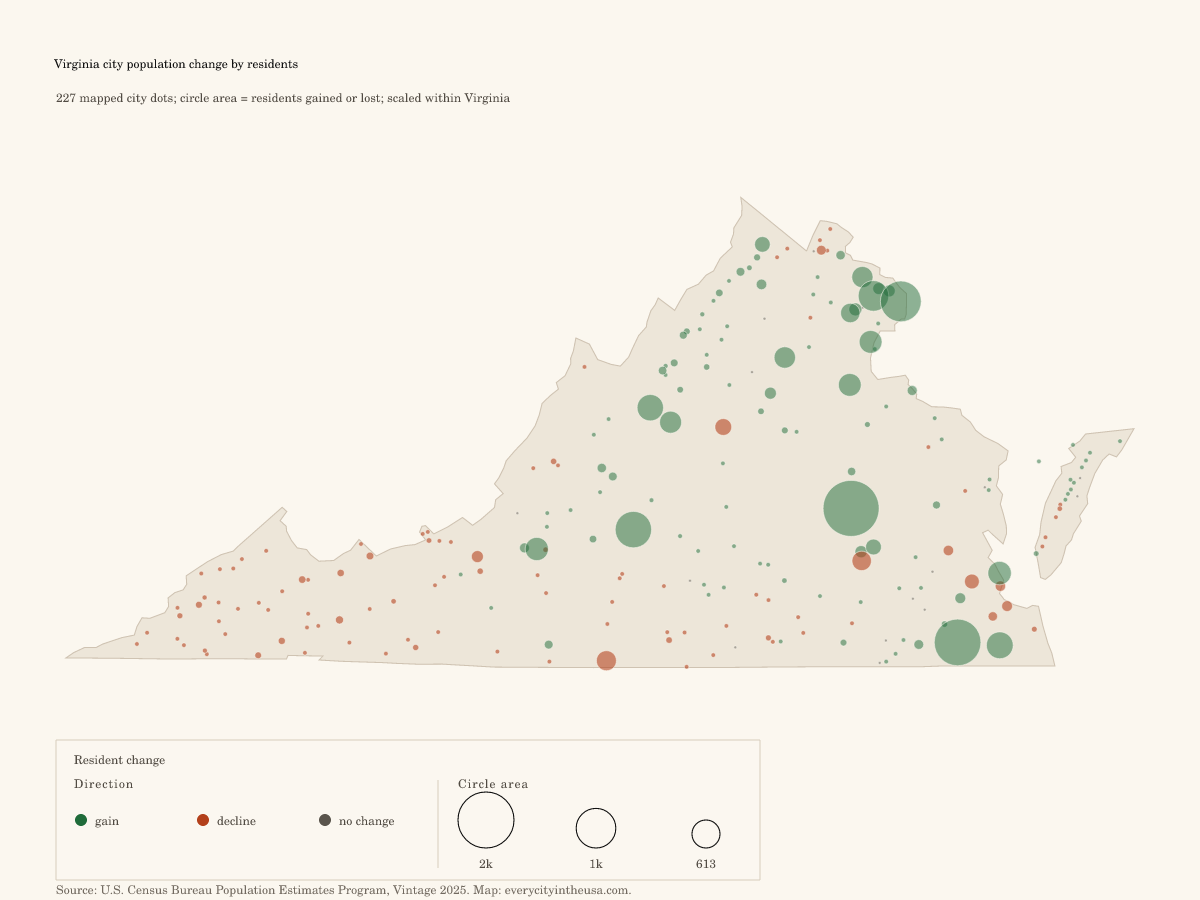
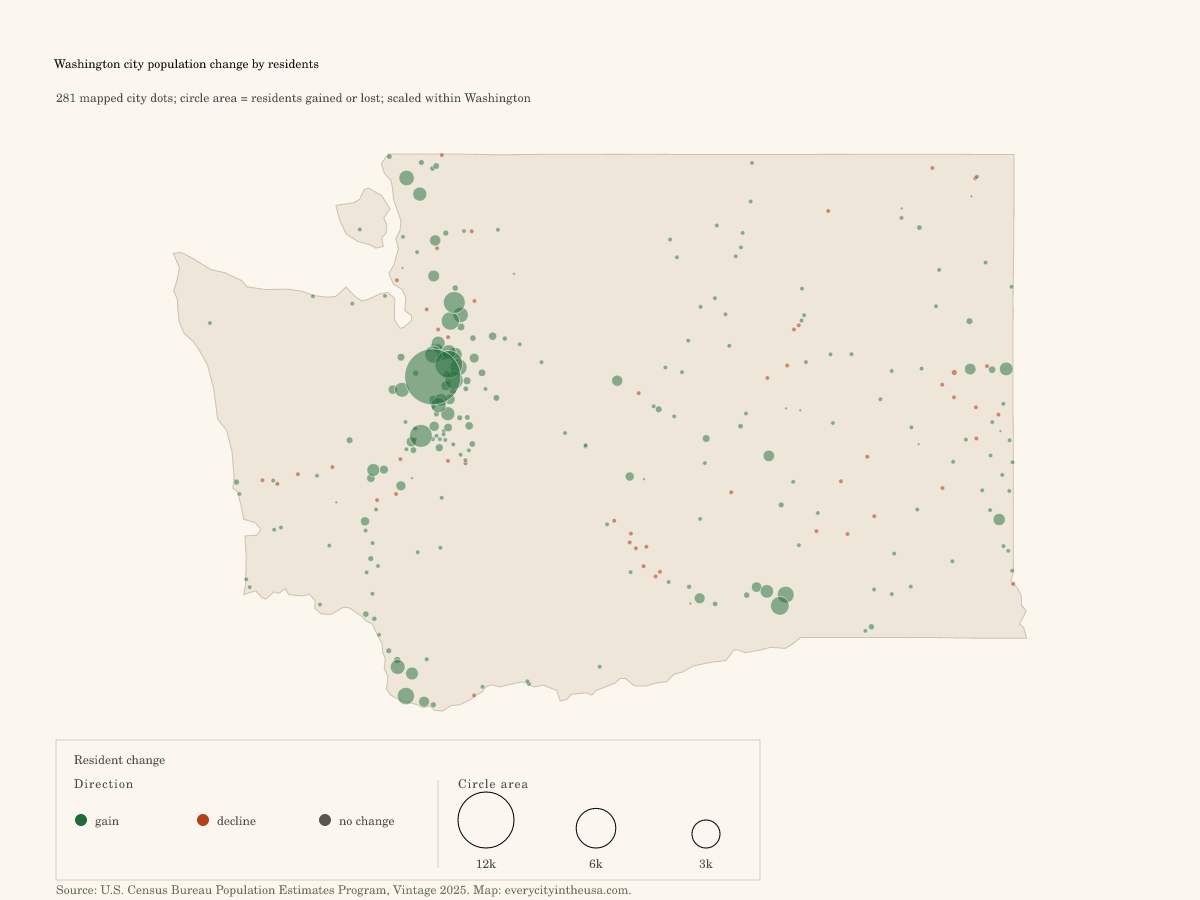
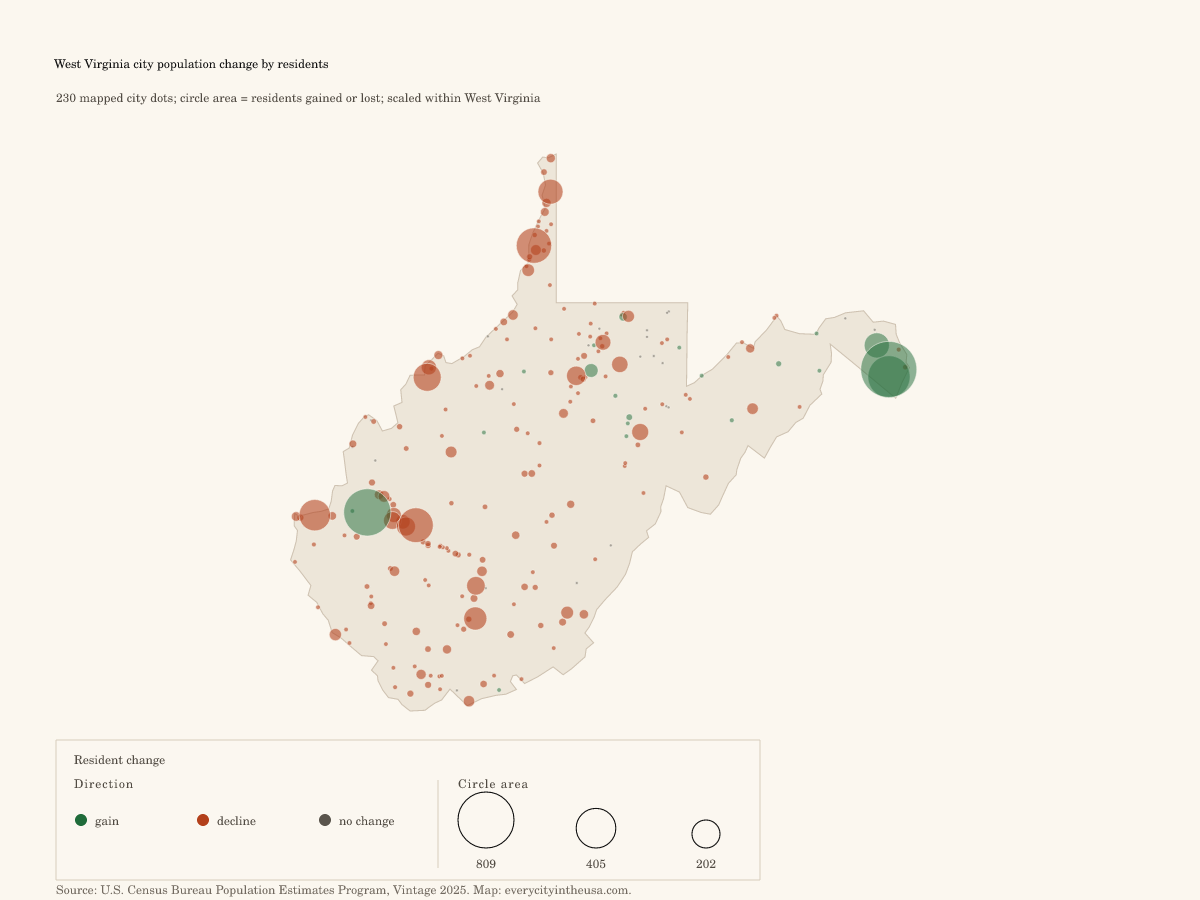
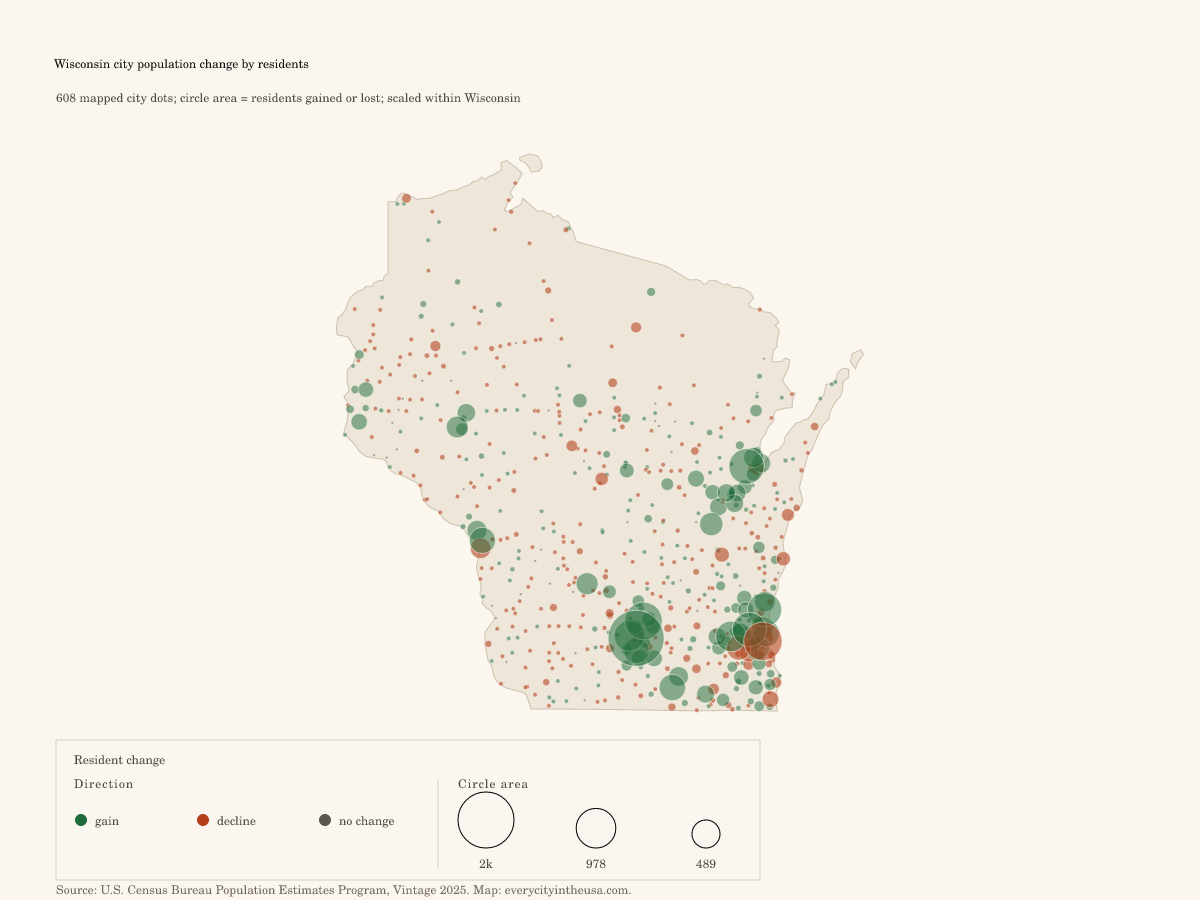
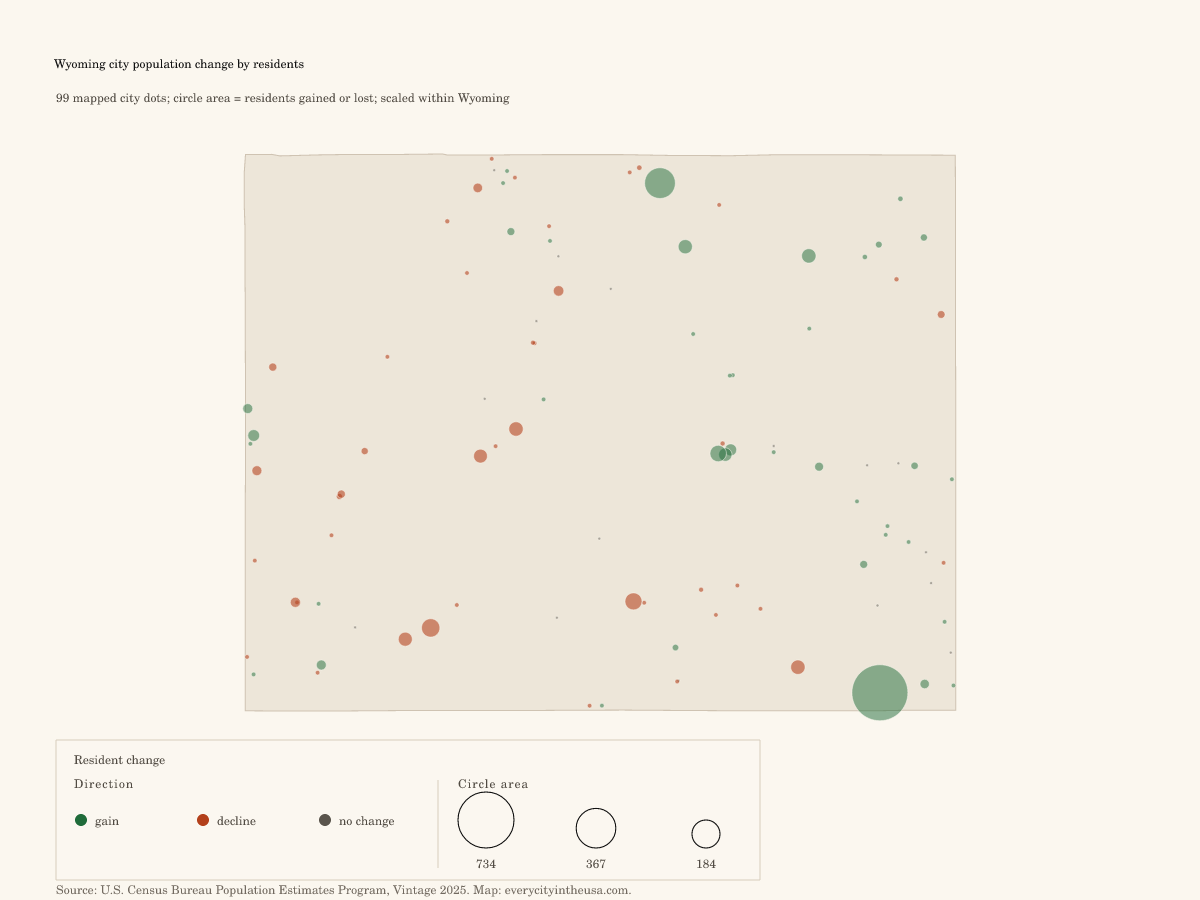
Compare that with resident-count change
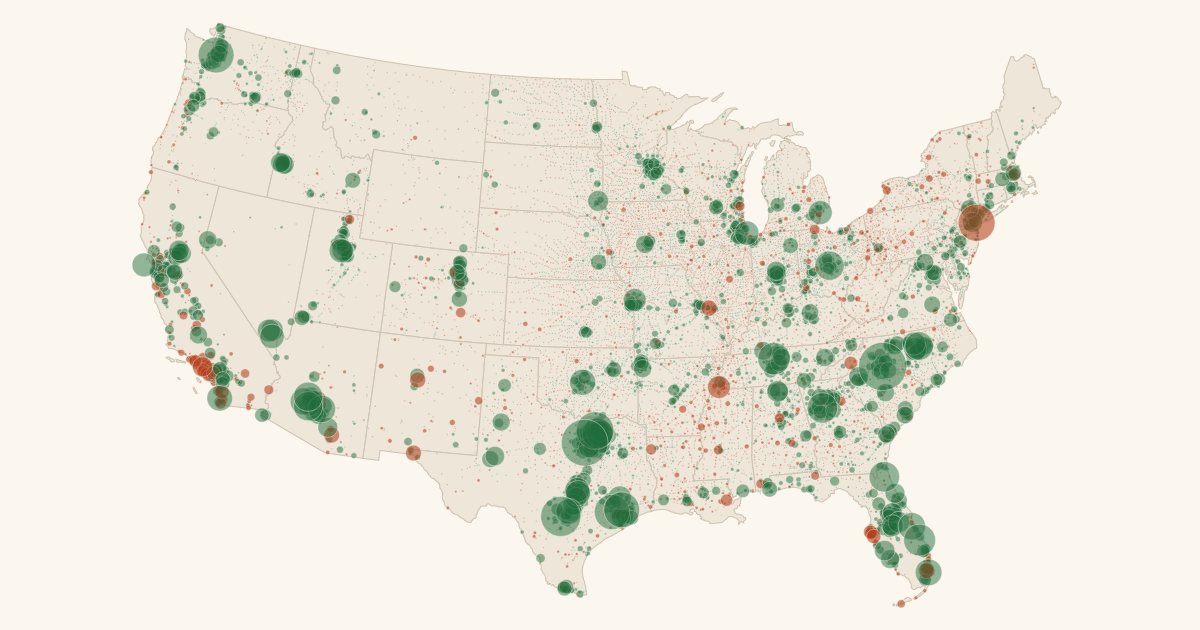
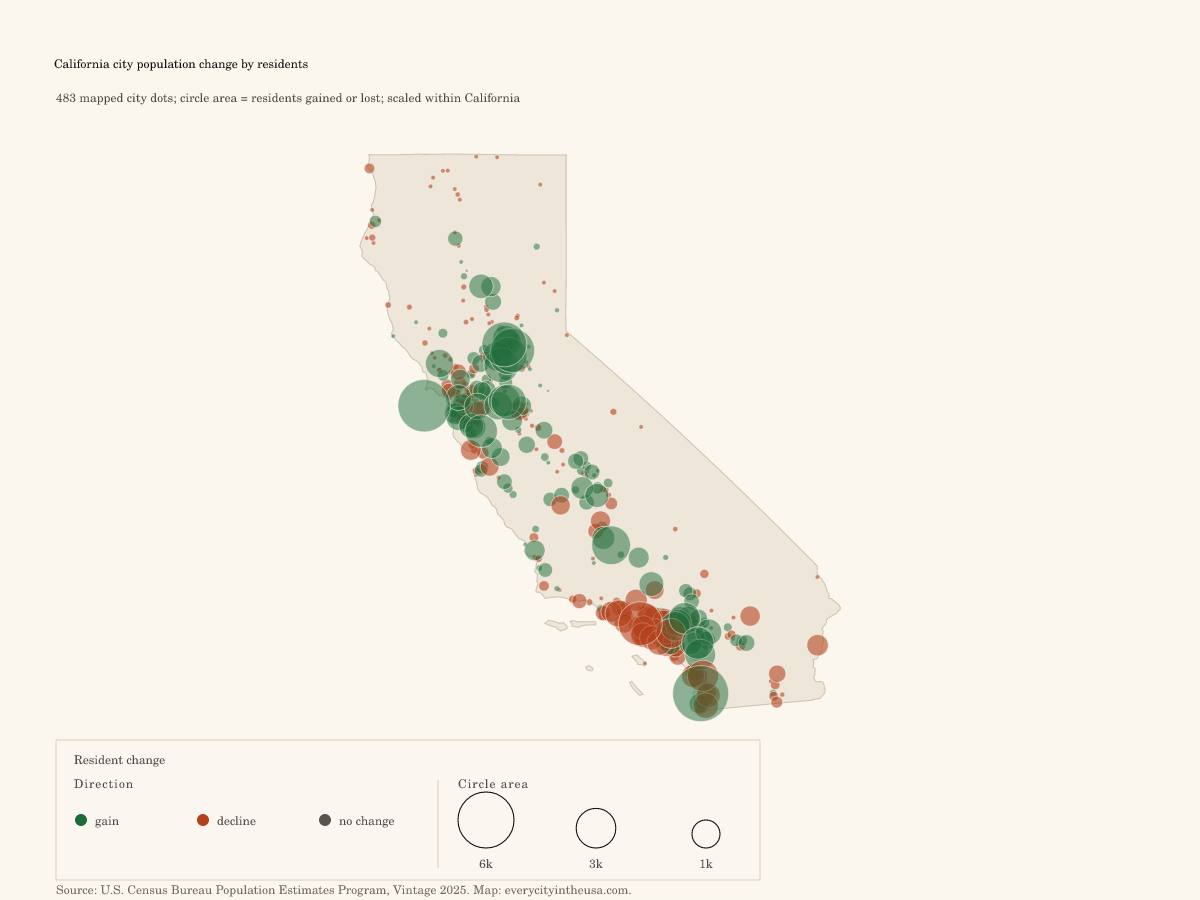
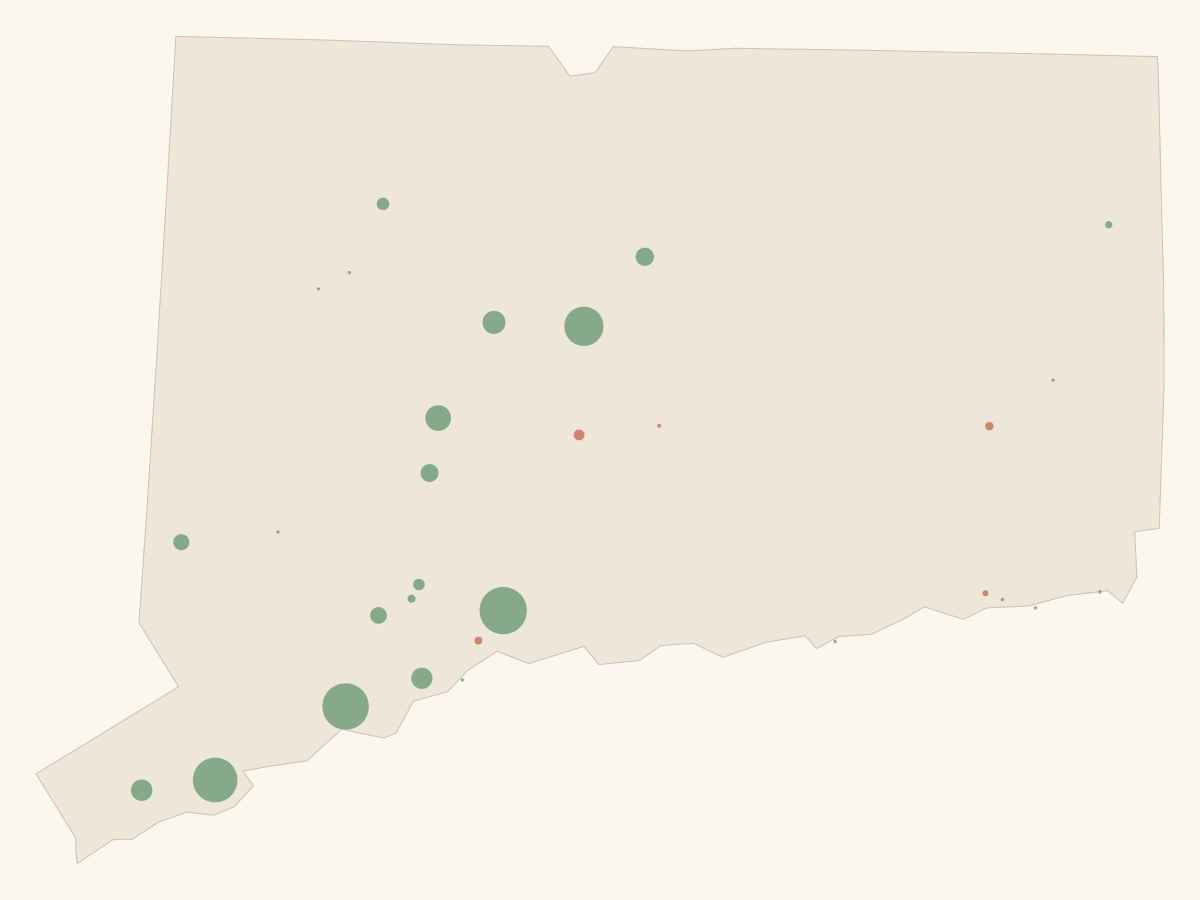
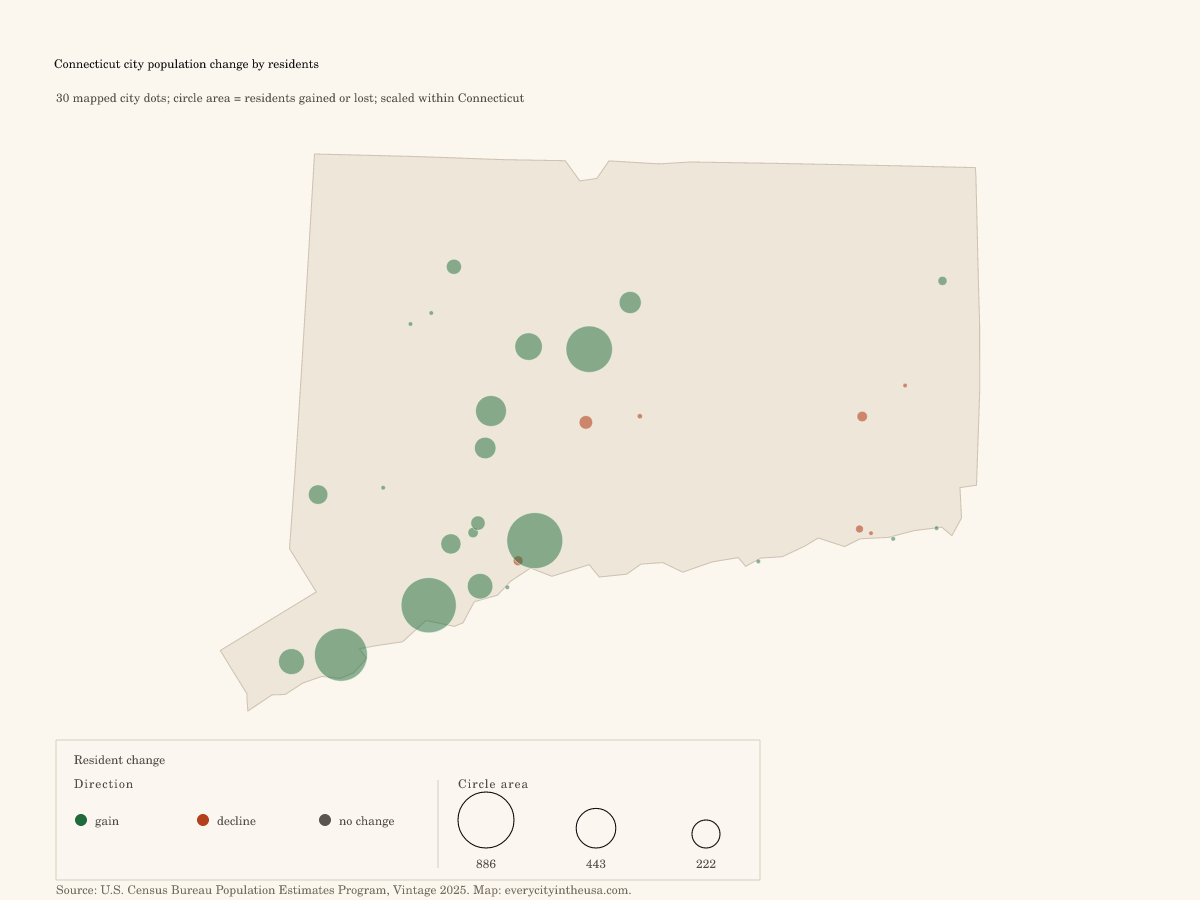
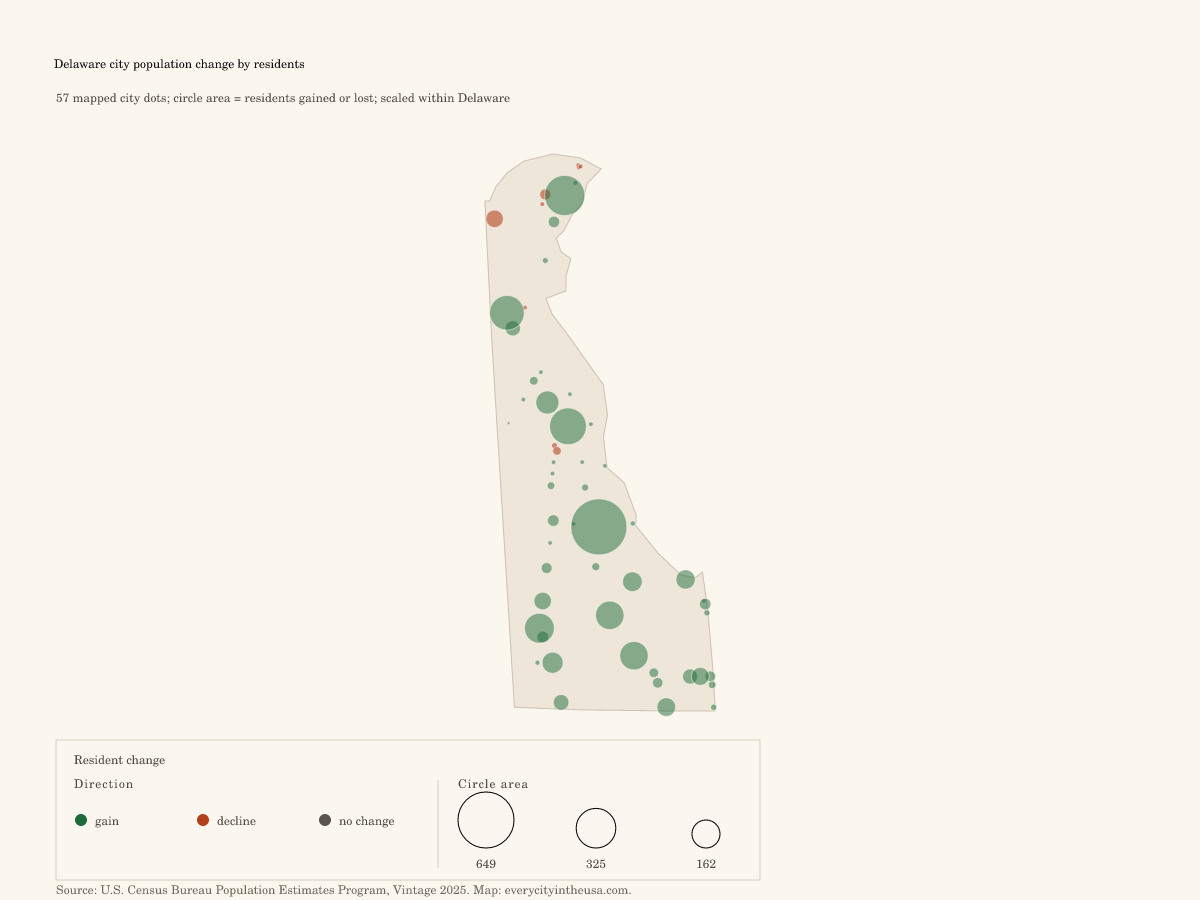
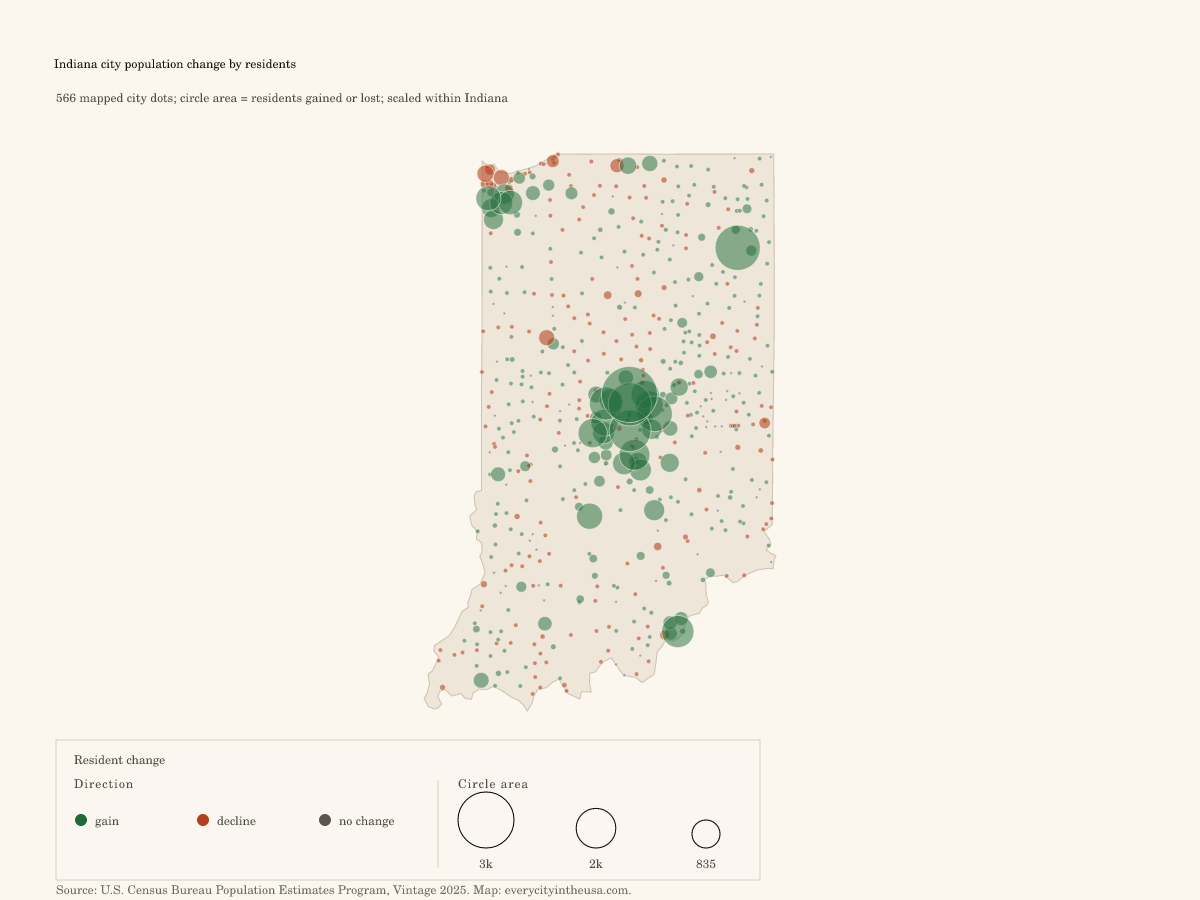
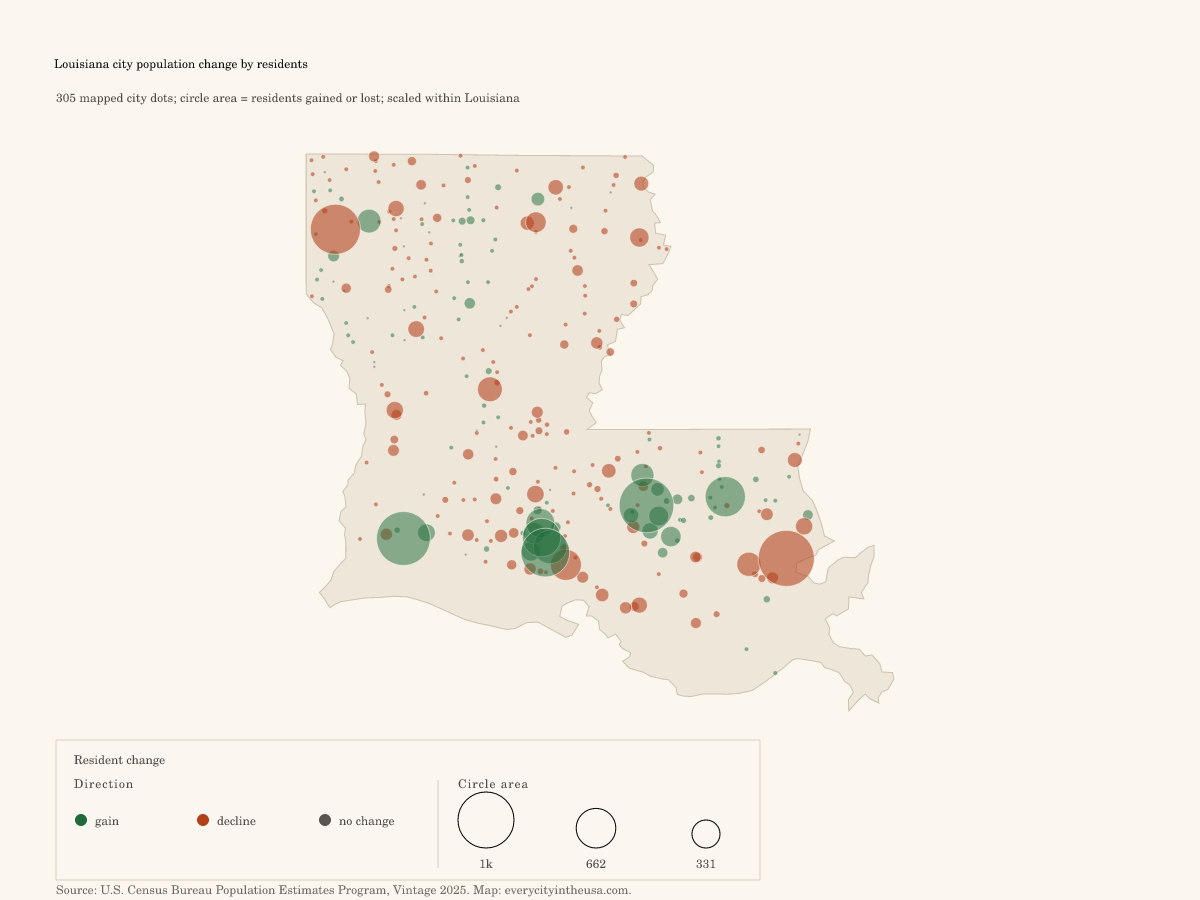
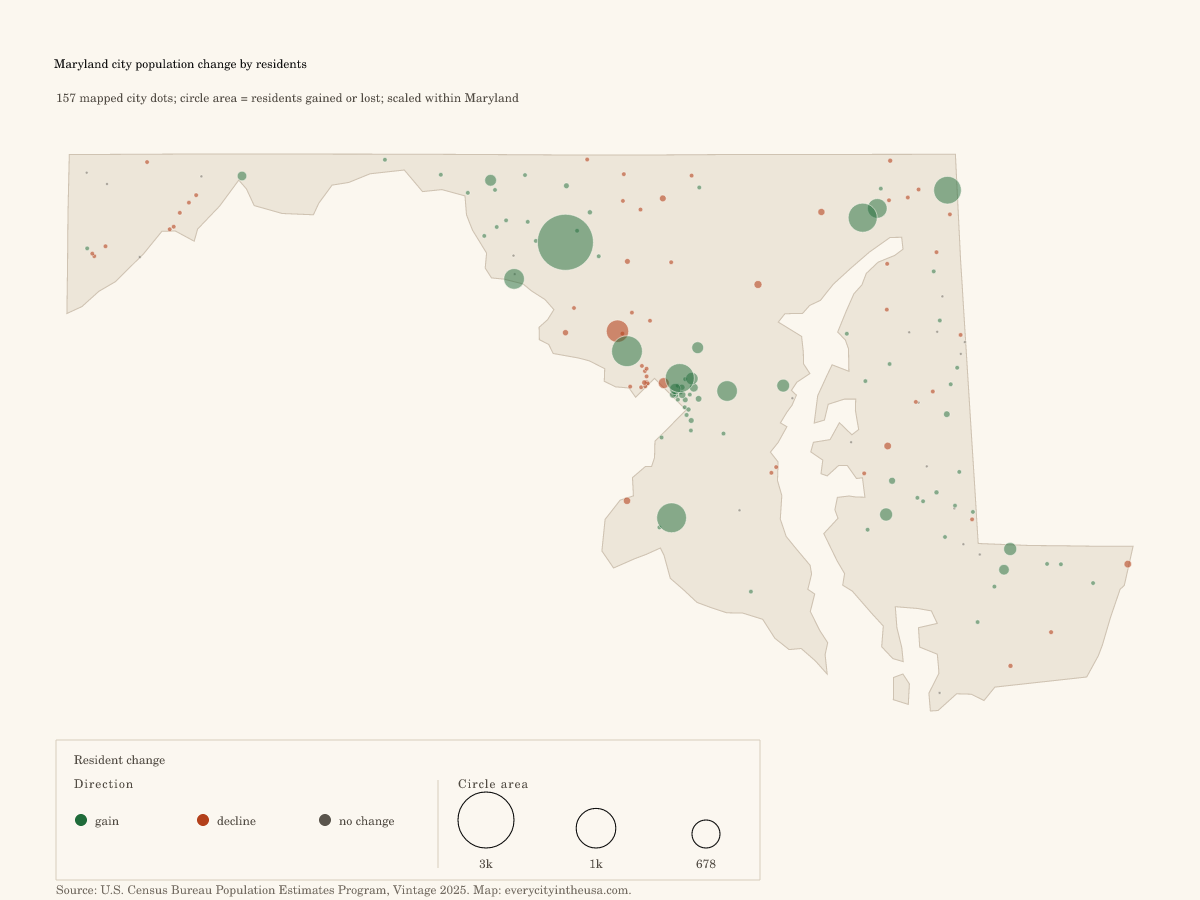
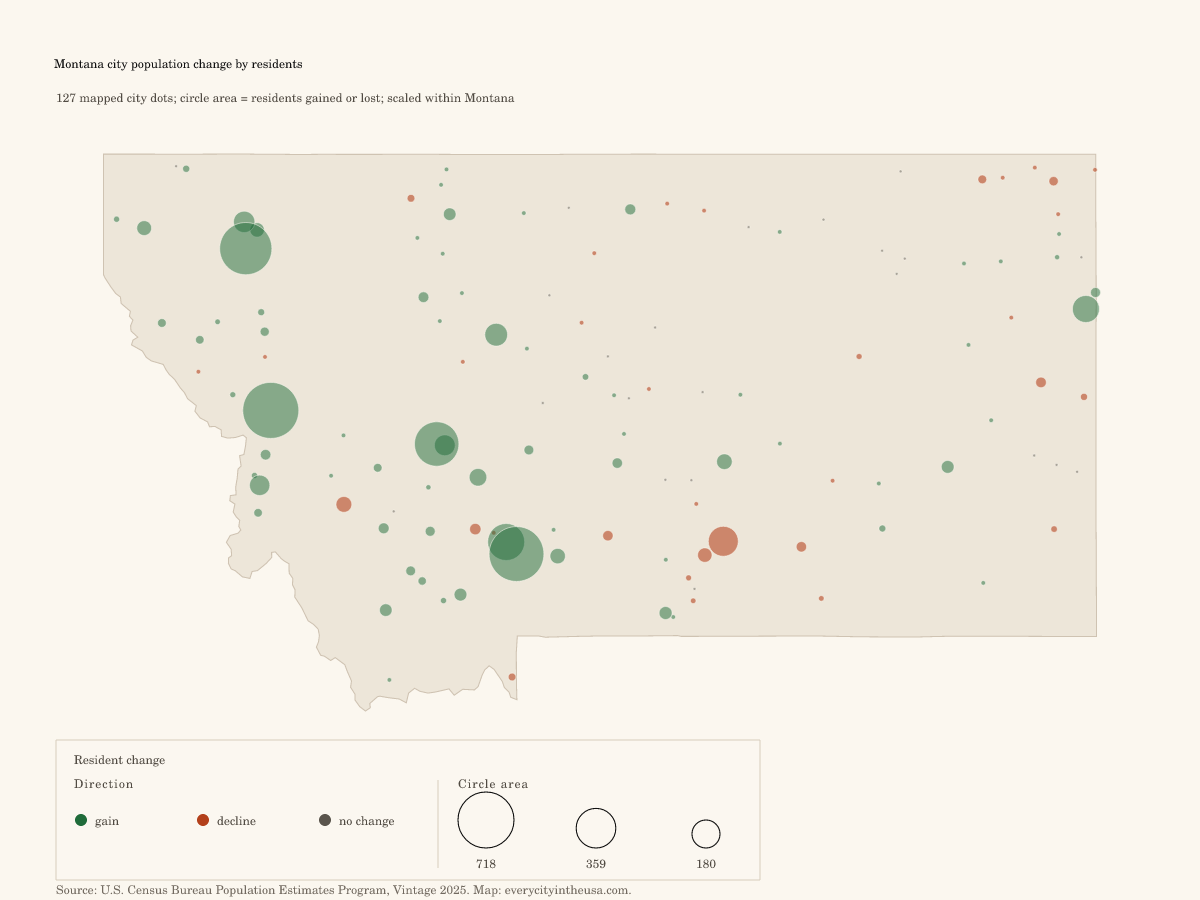
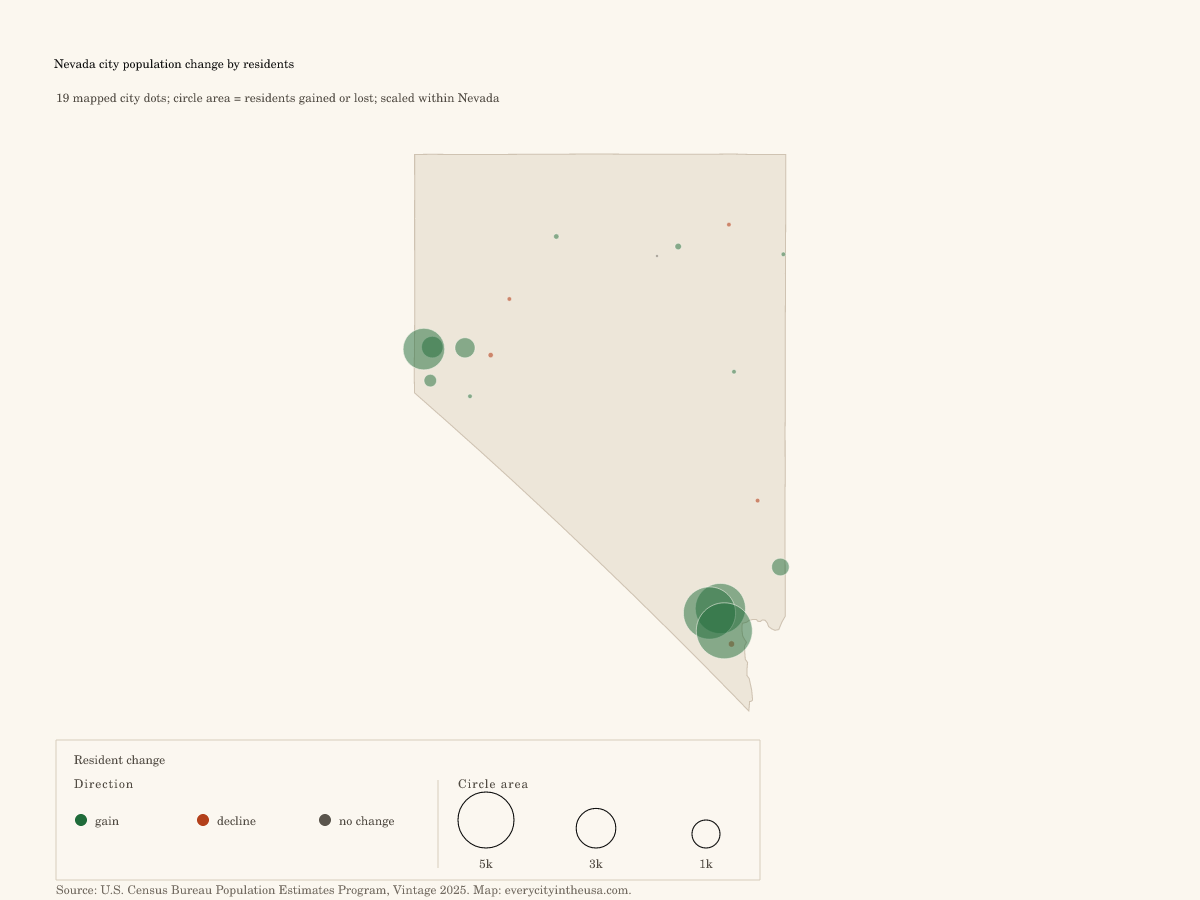
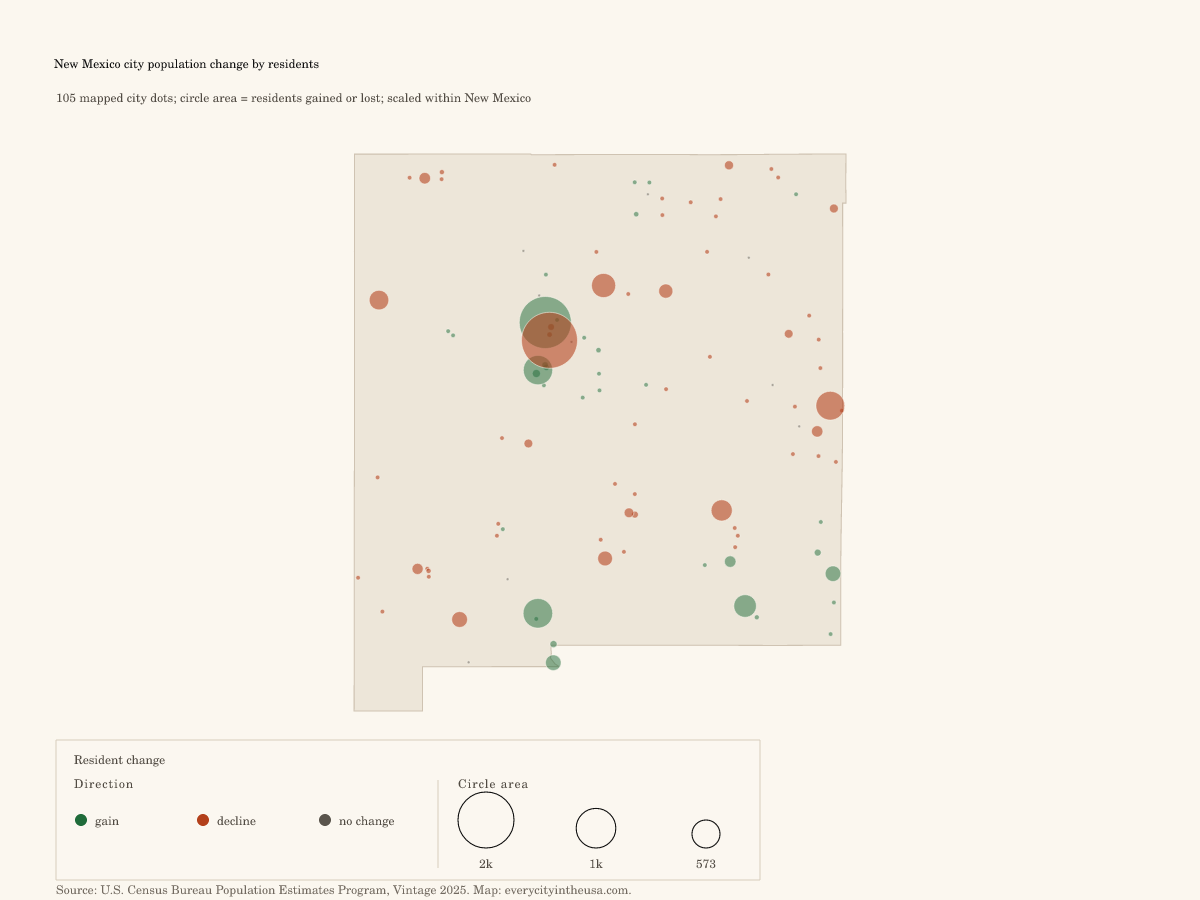
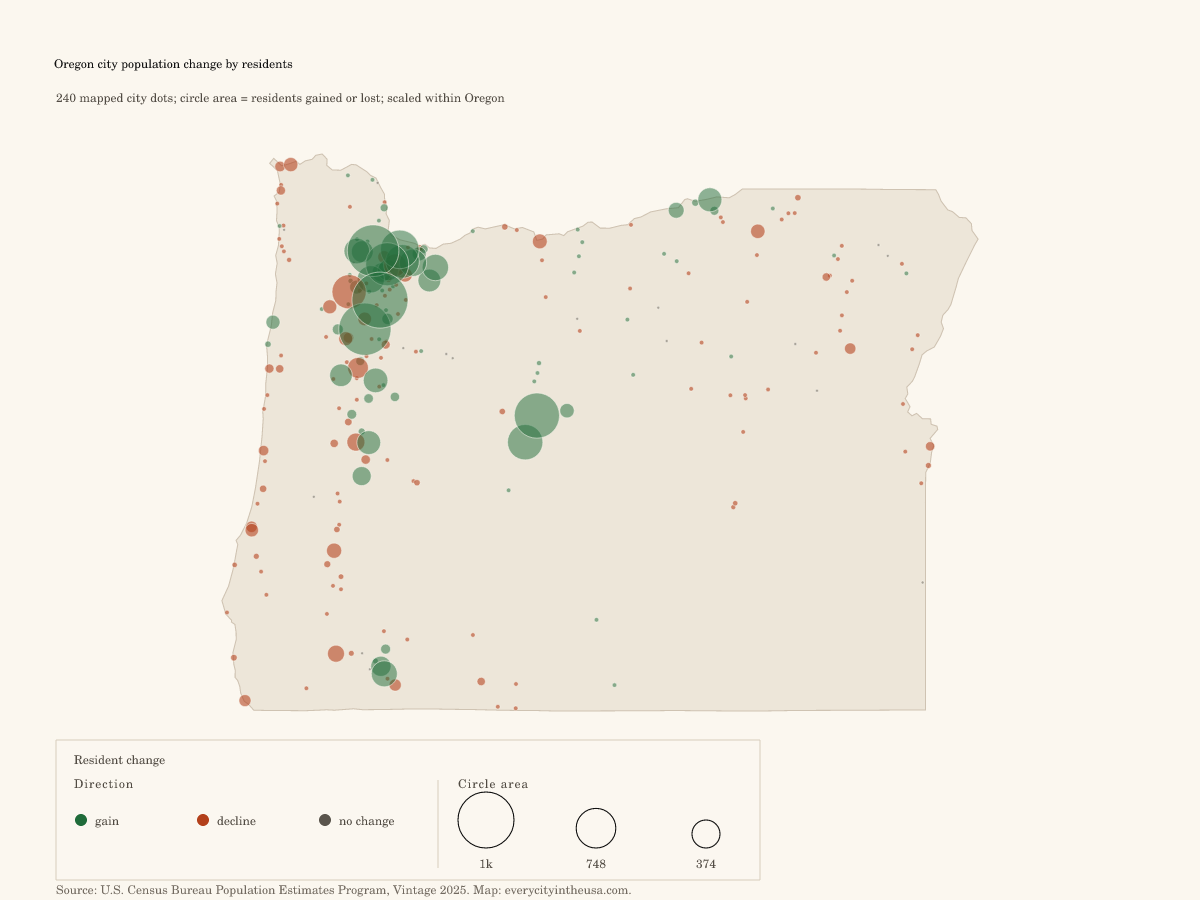
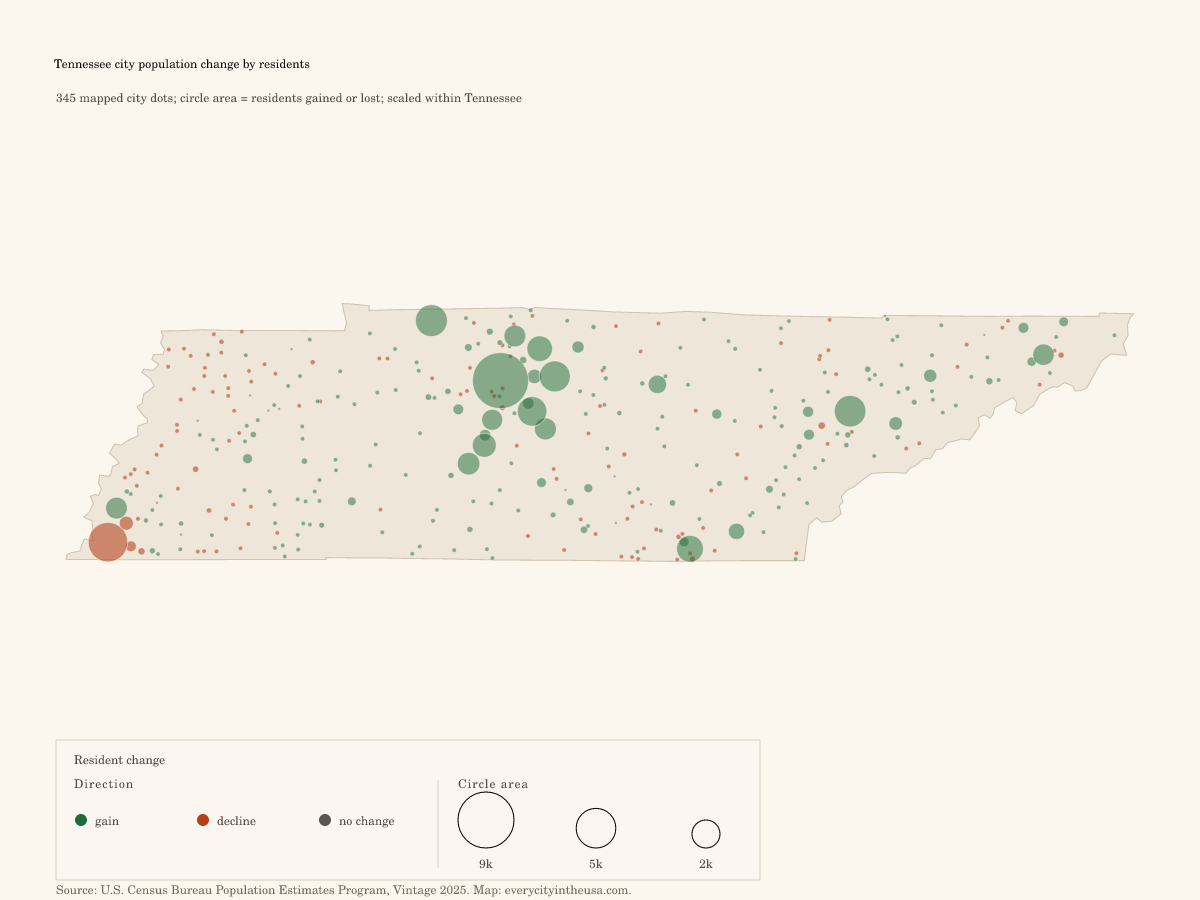
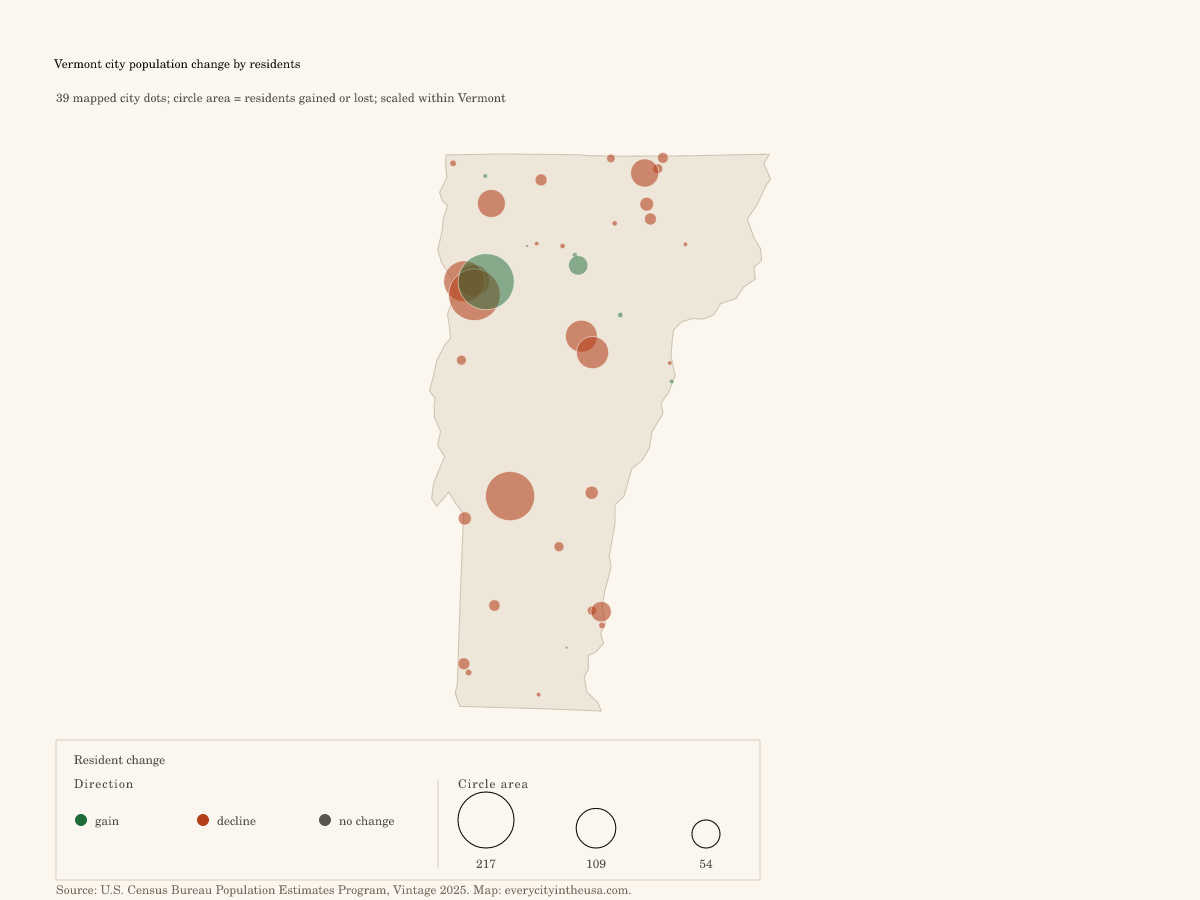
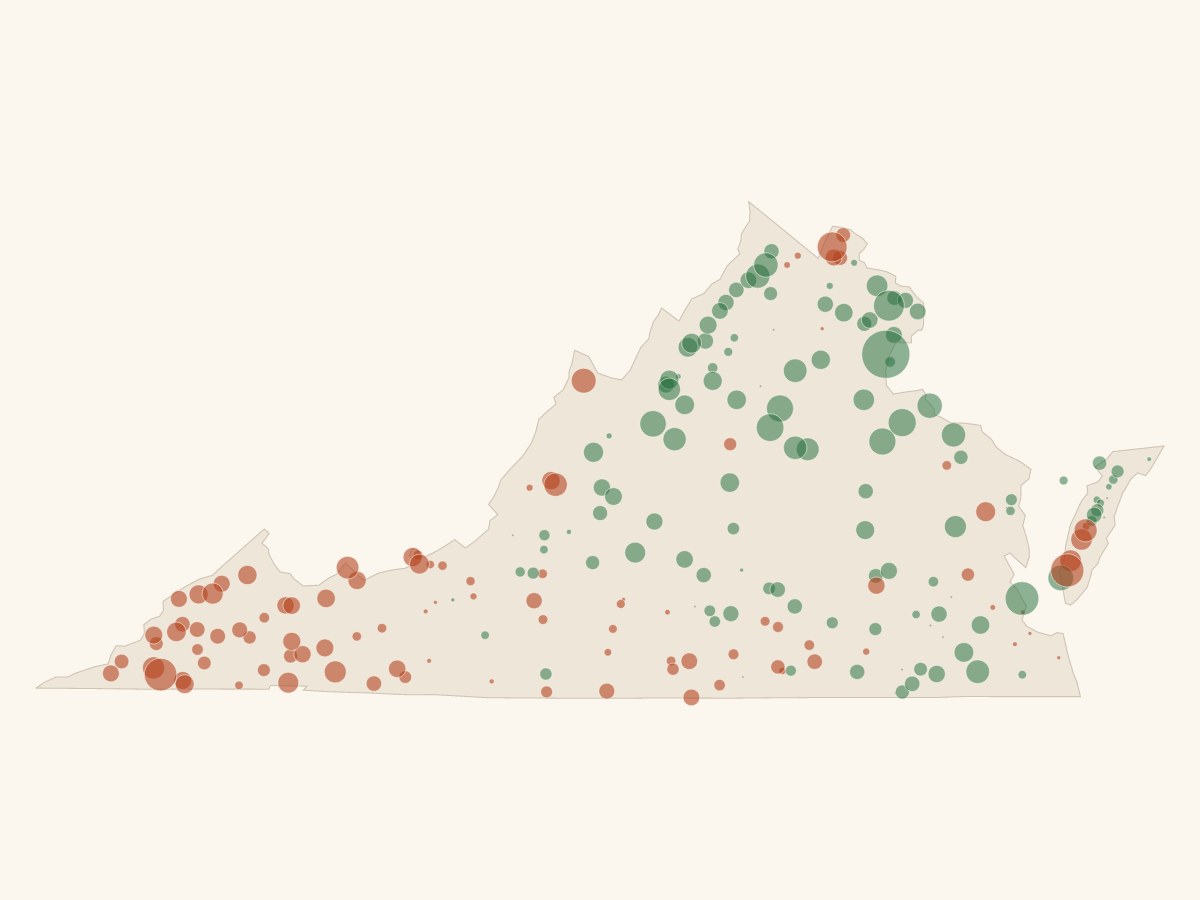
19,483 mapped cities · circle area = residents
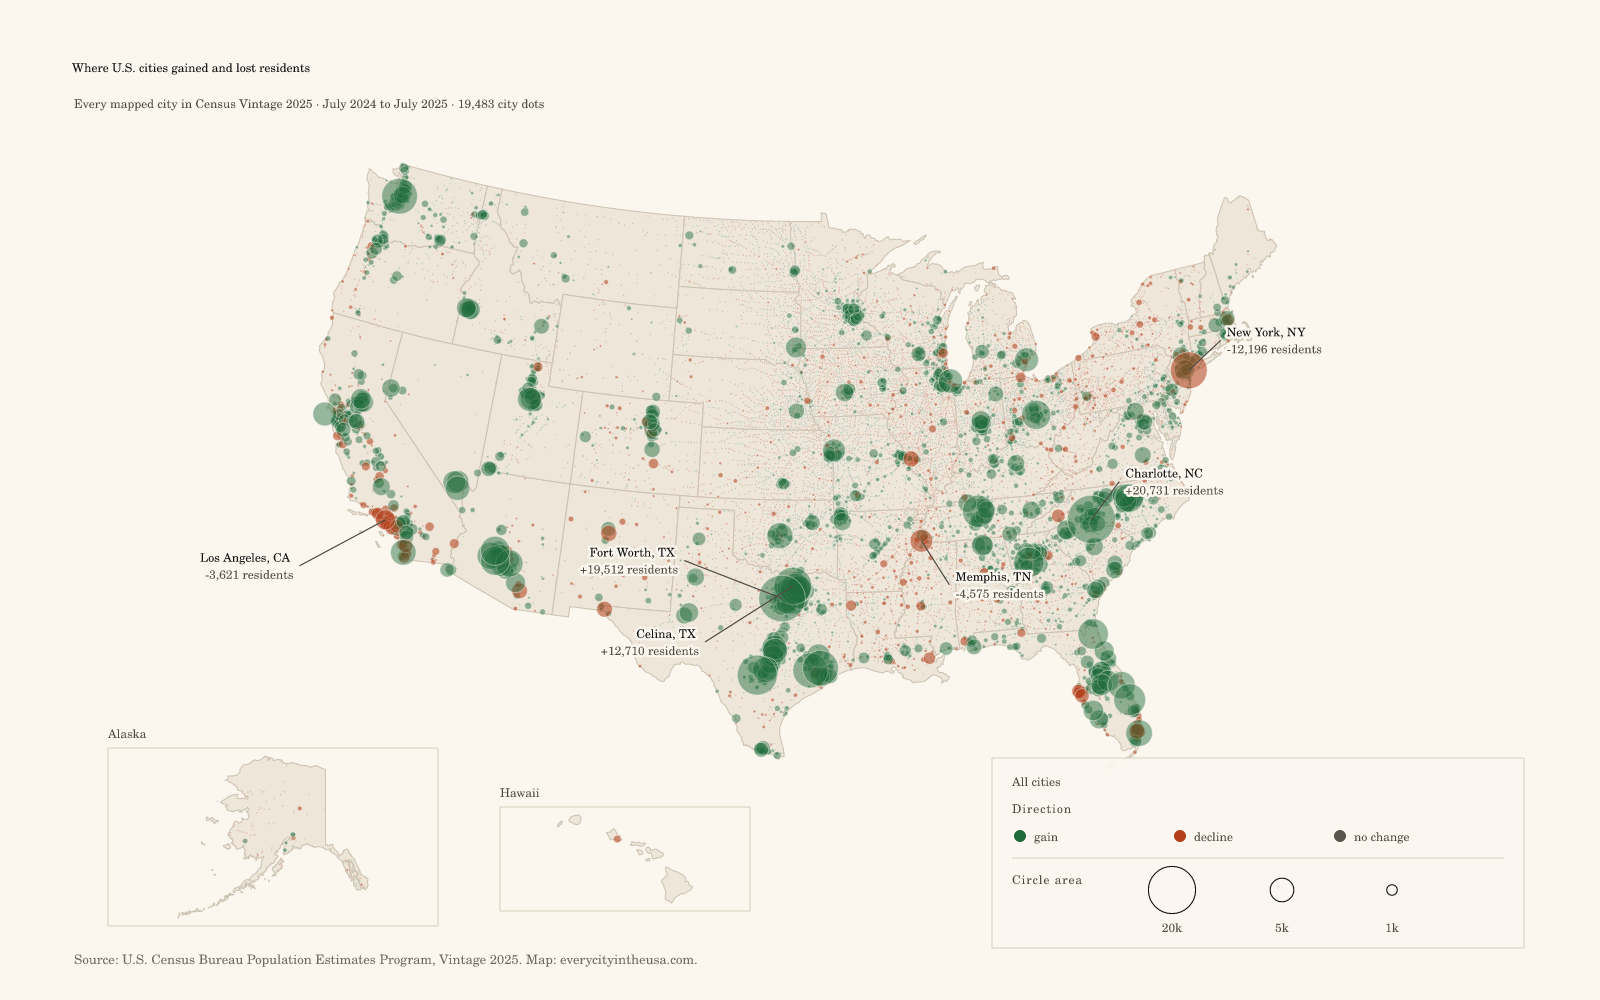
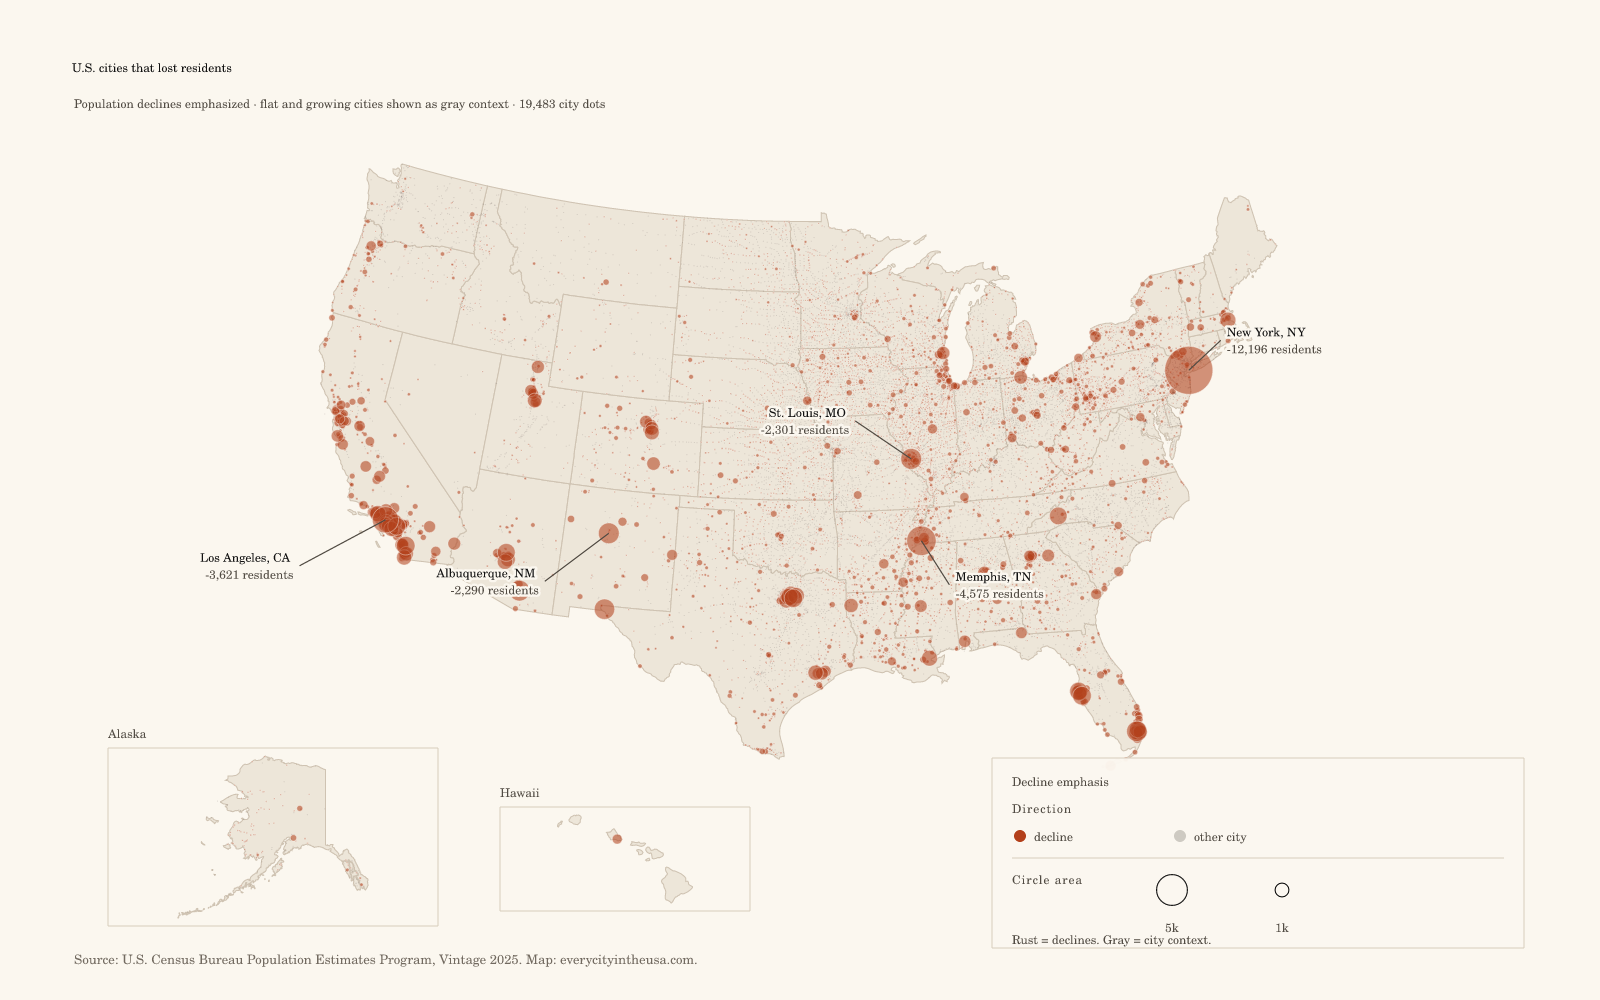
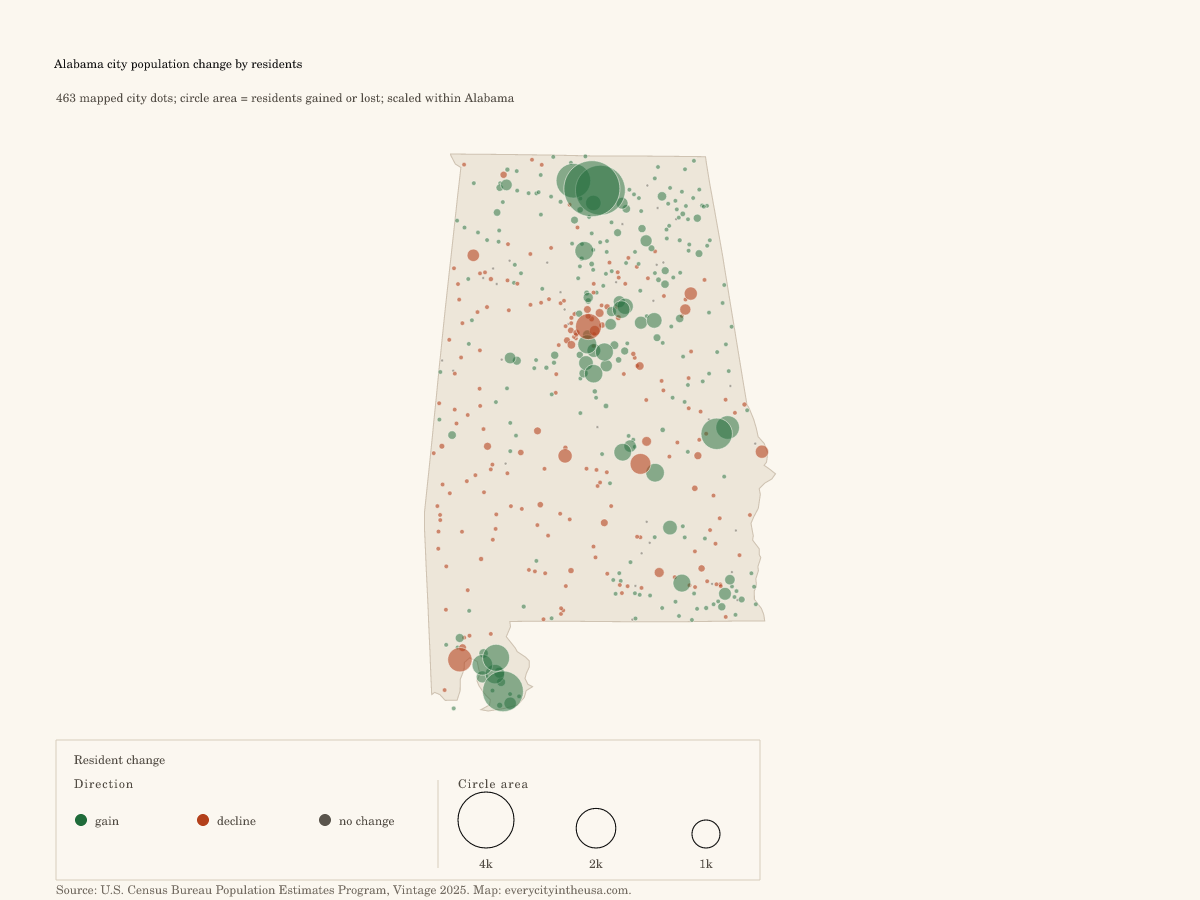
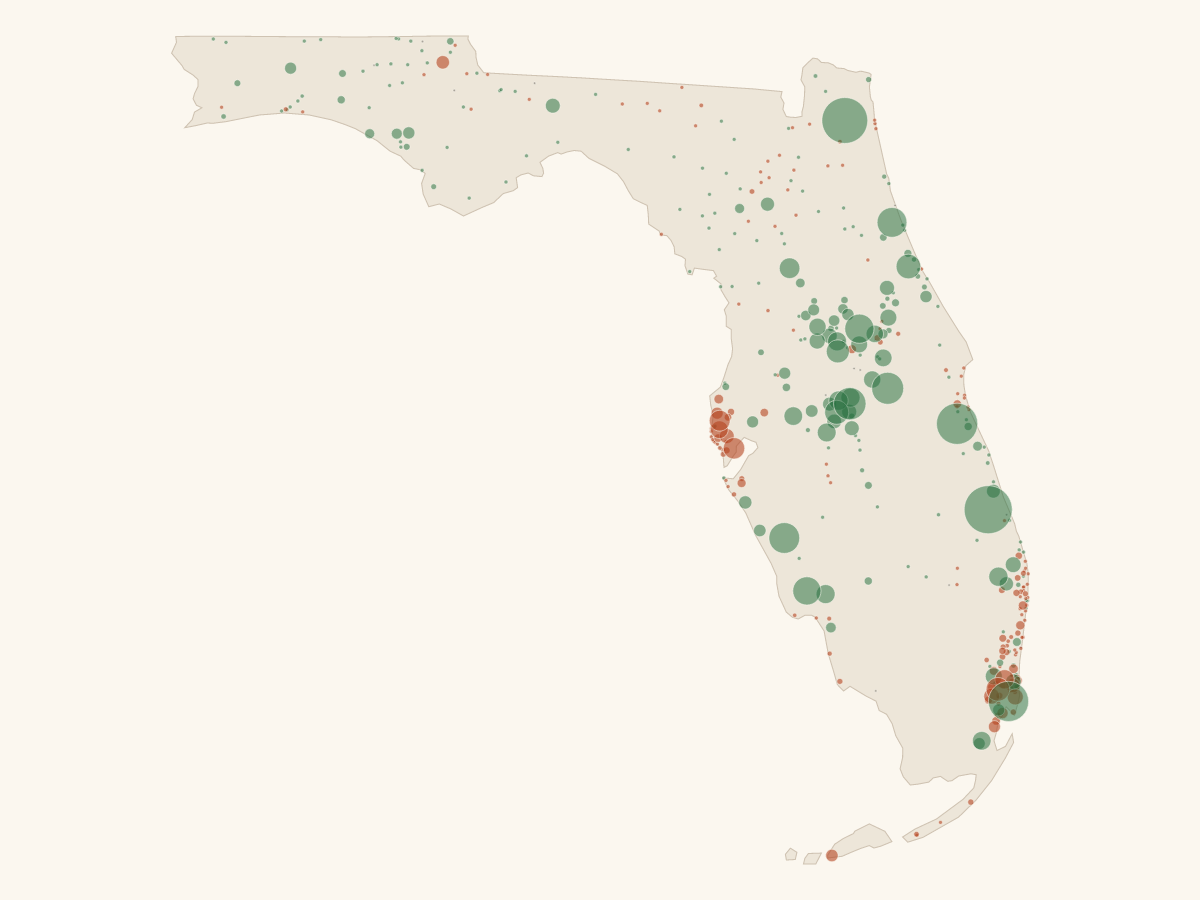
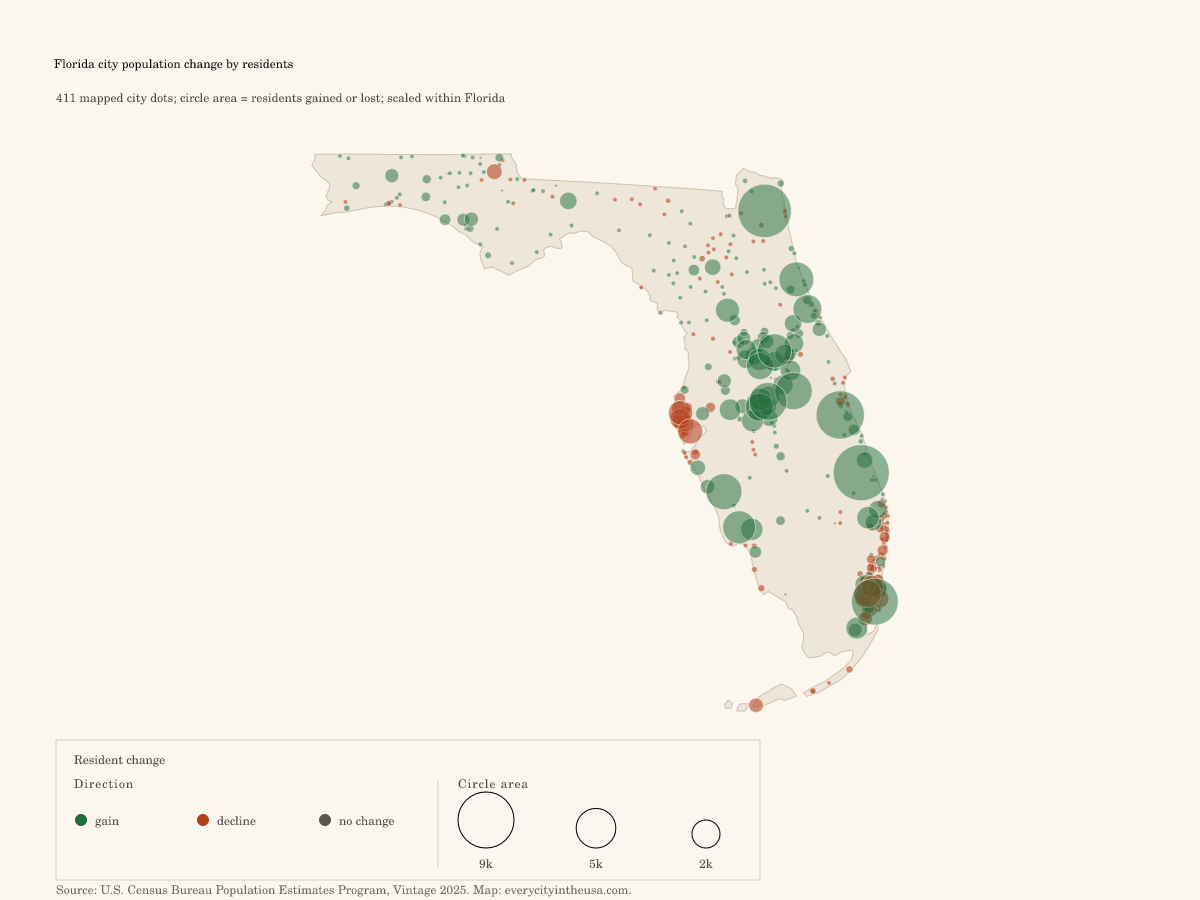
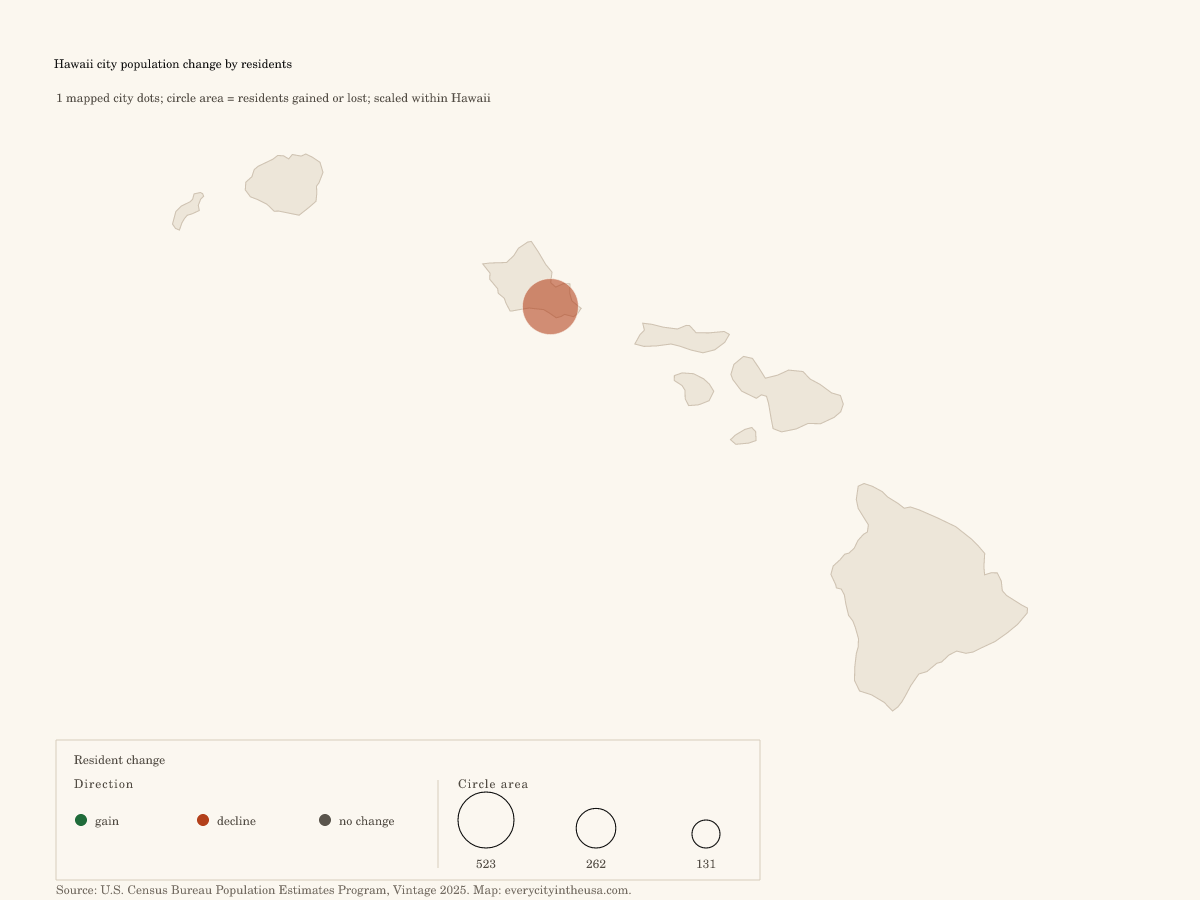
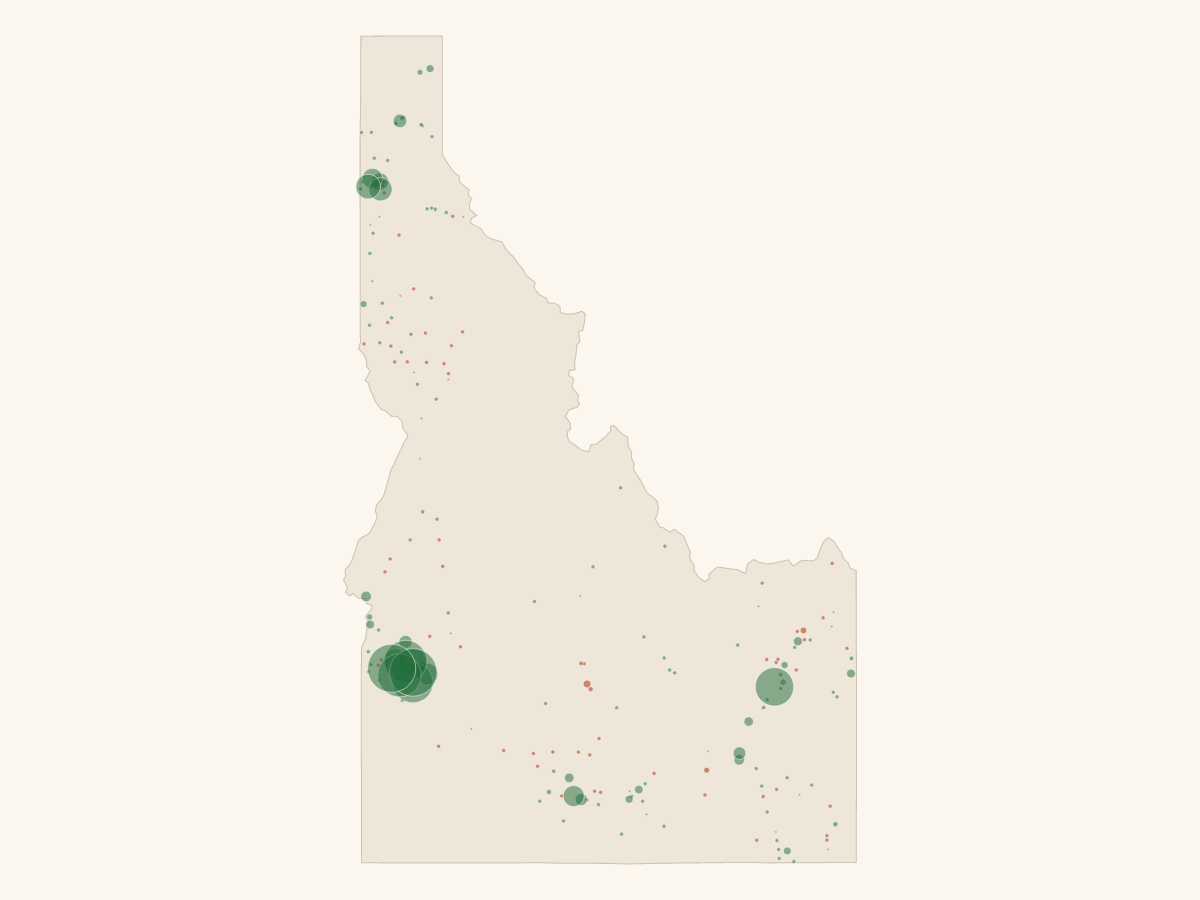
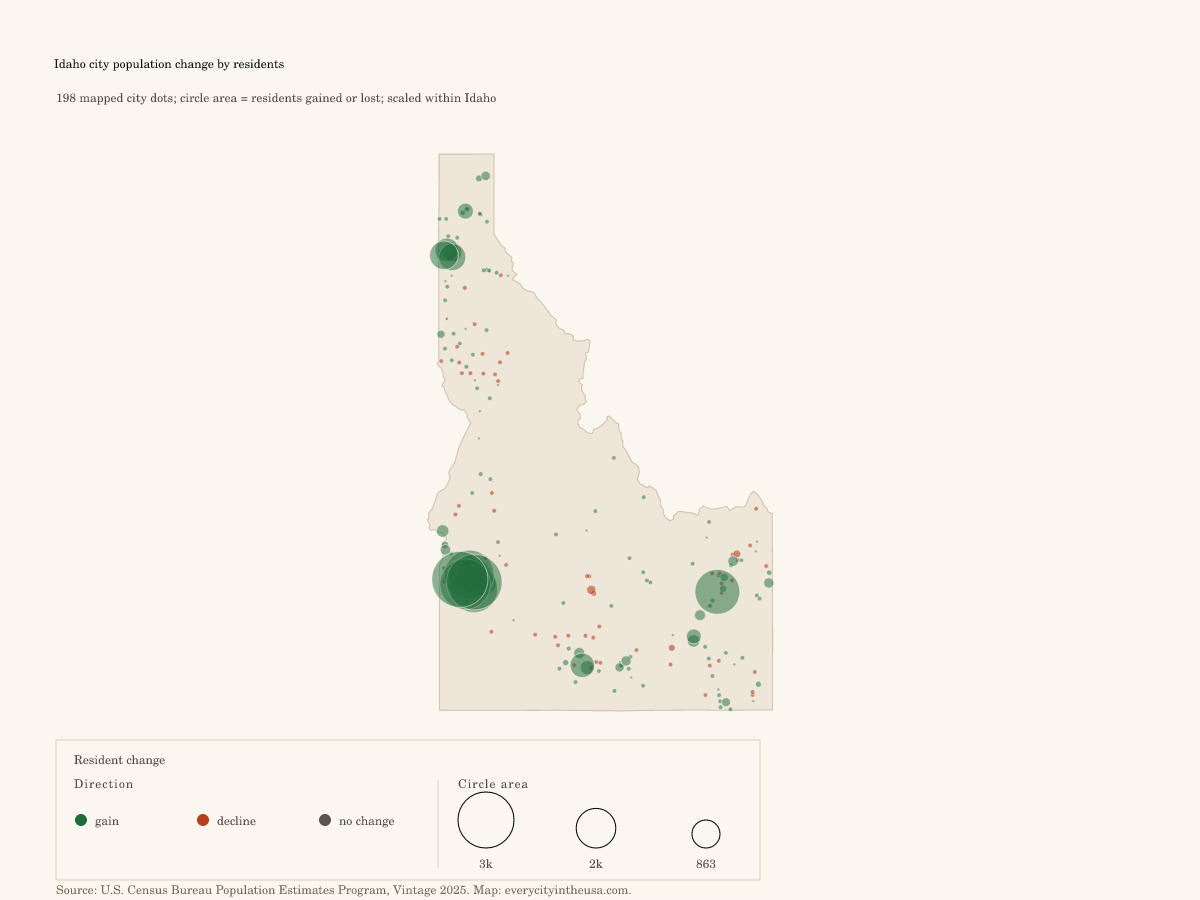
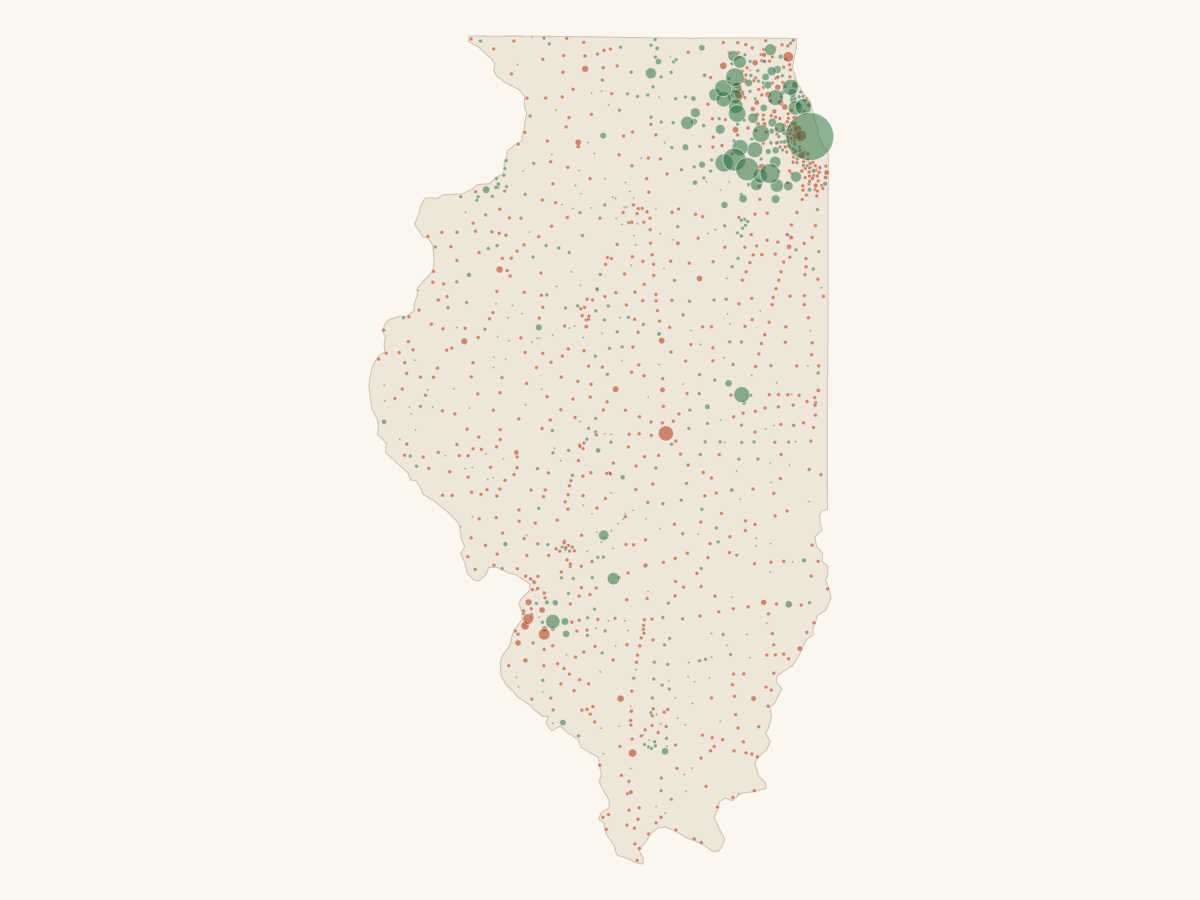
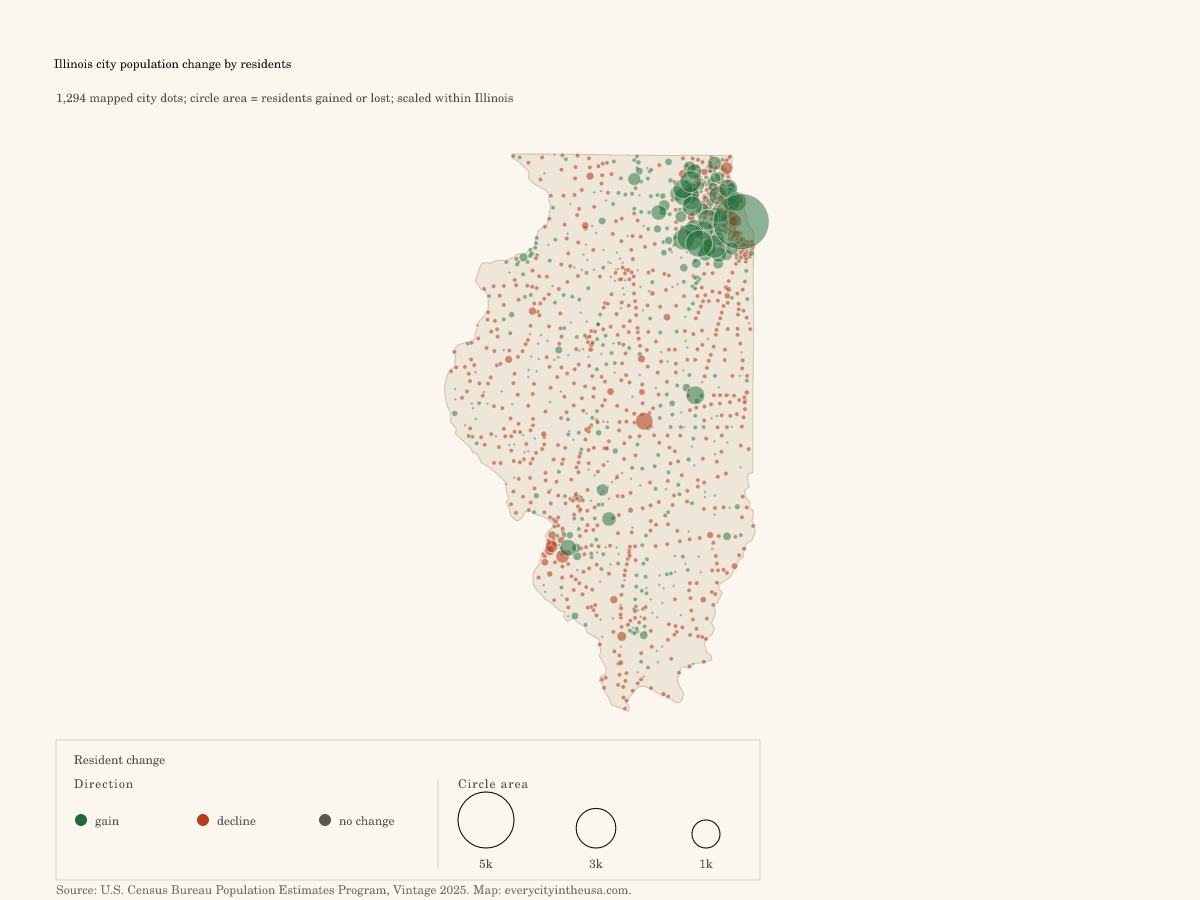
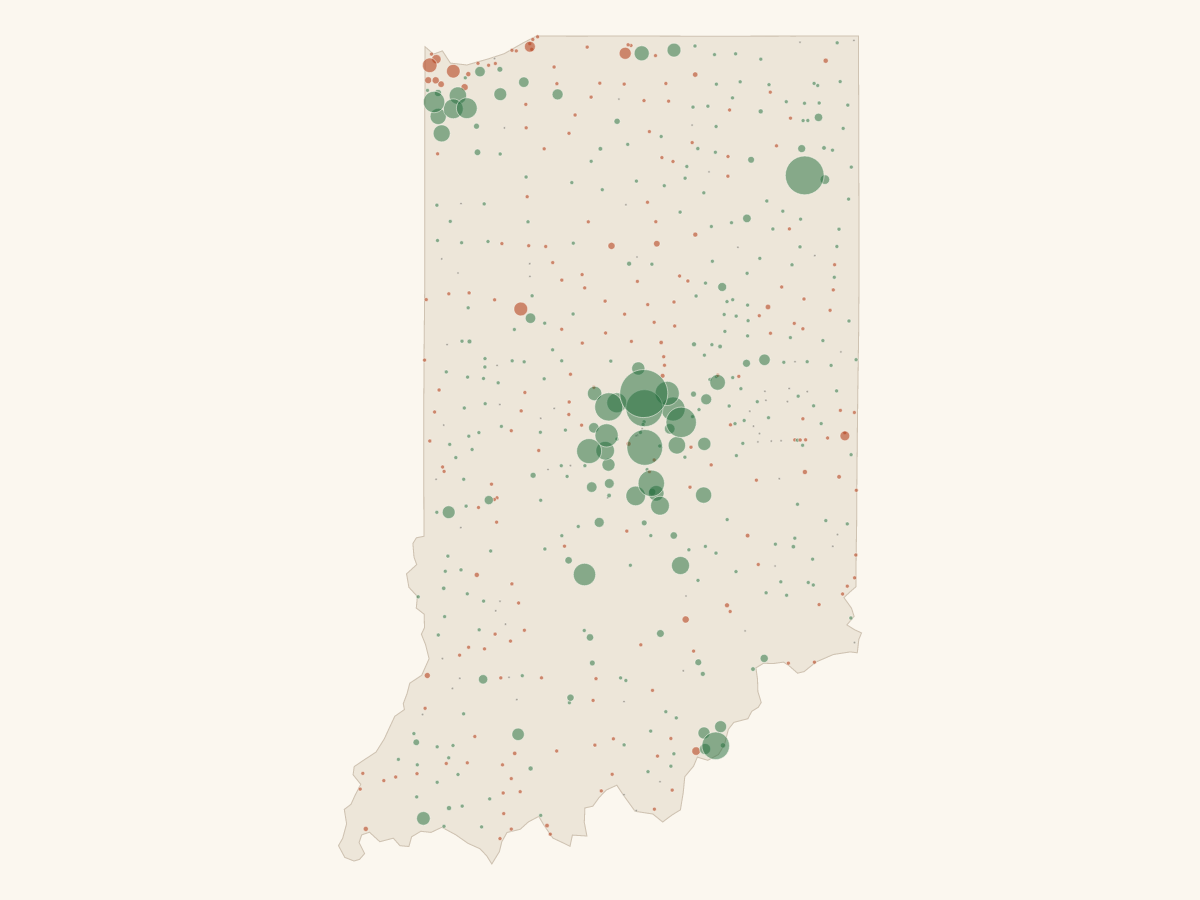
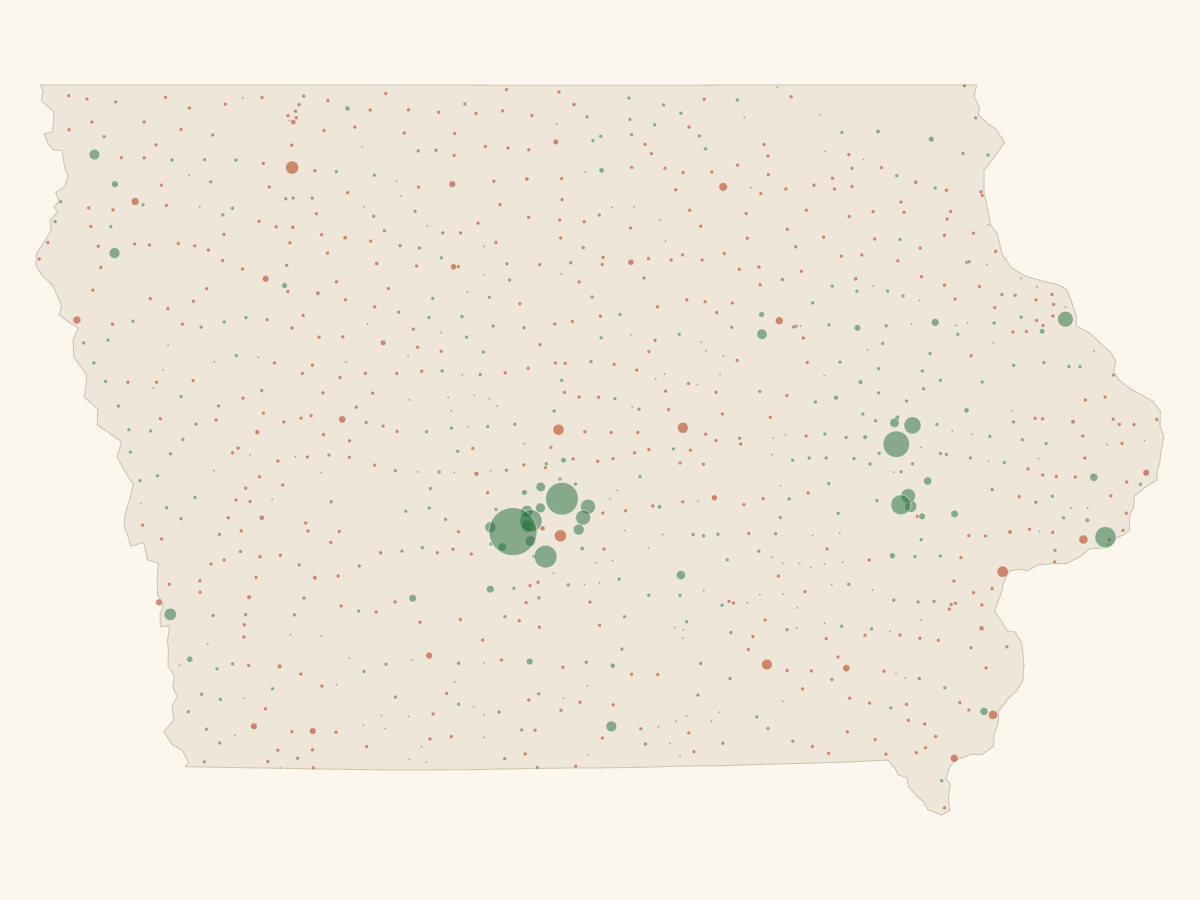
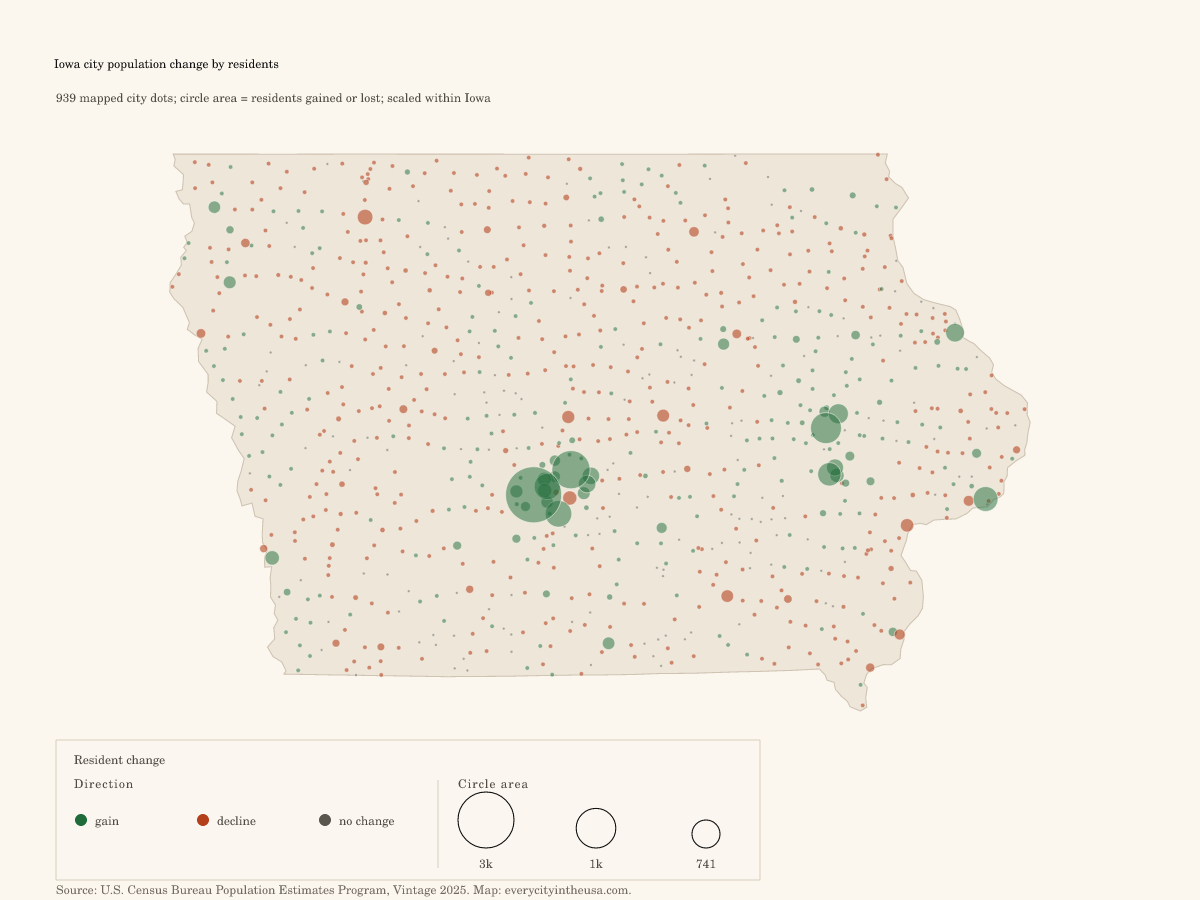
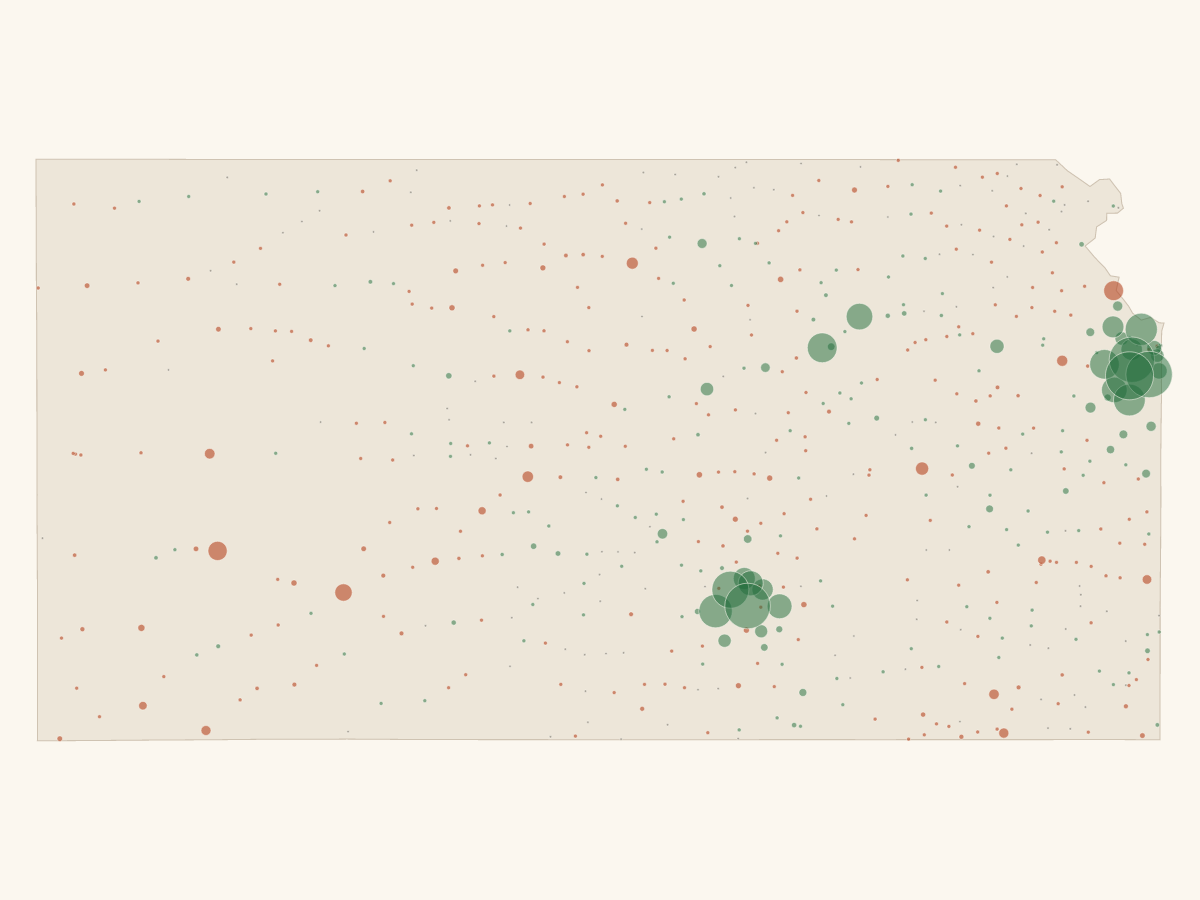
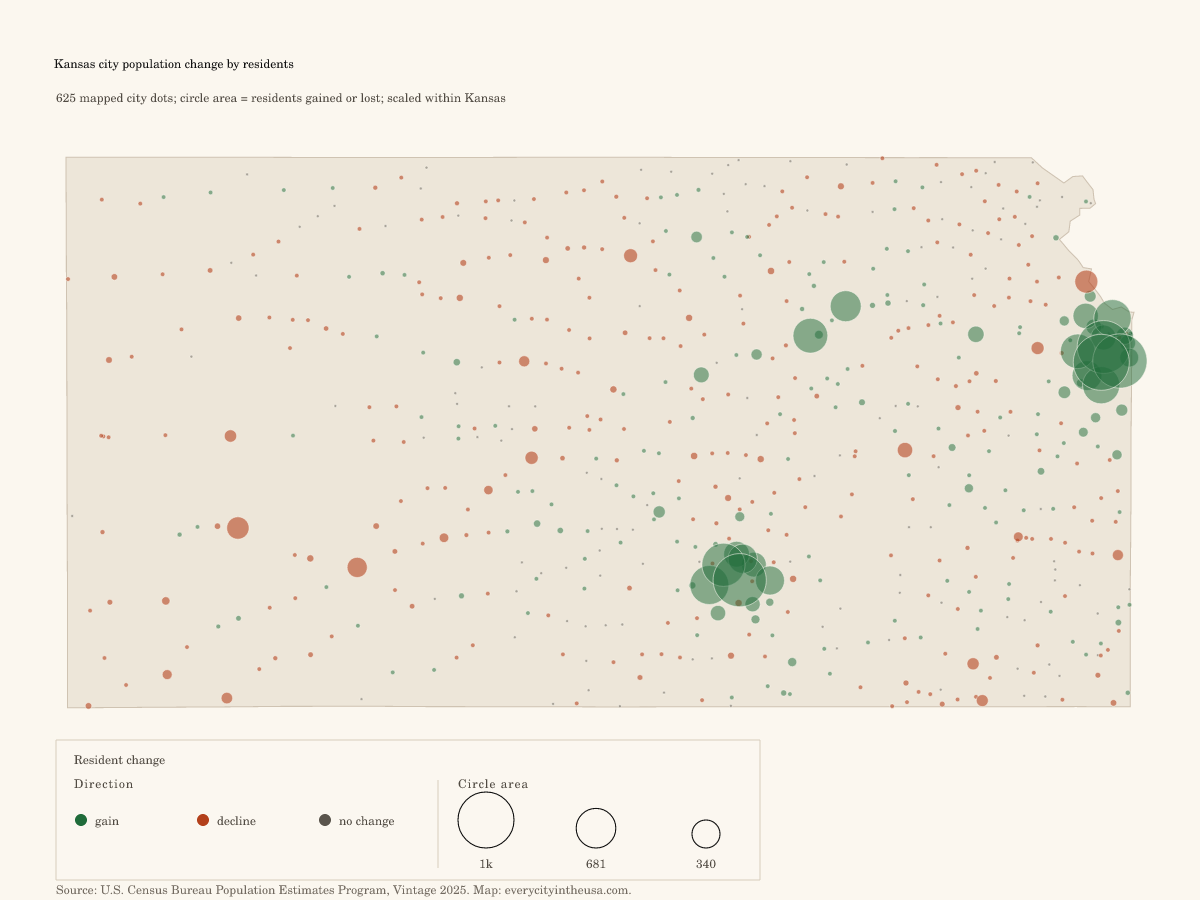
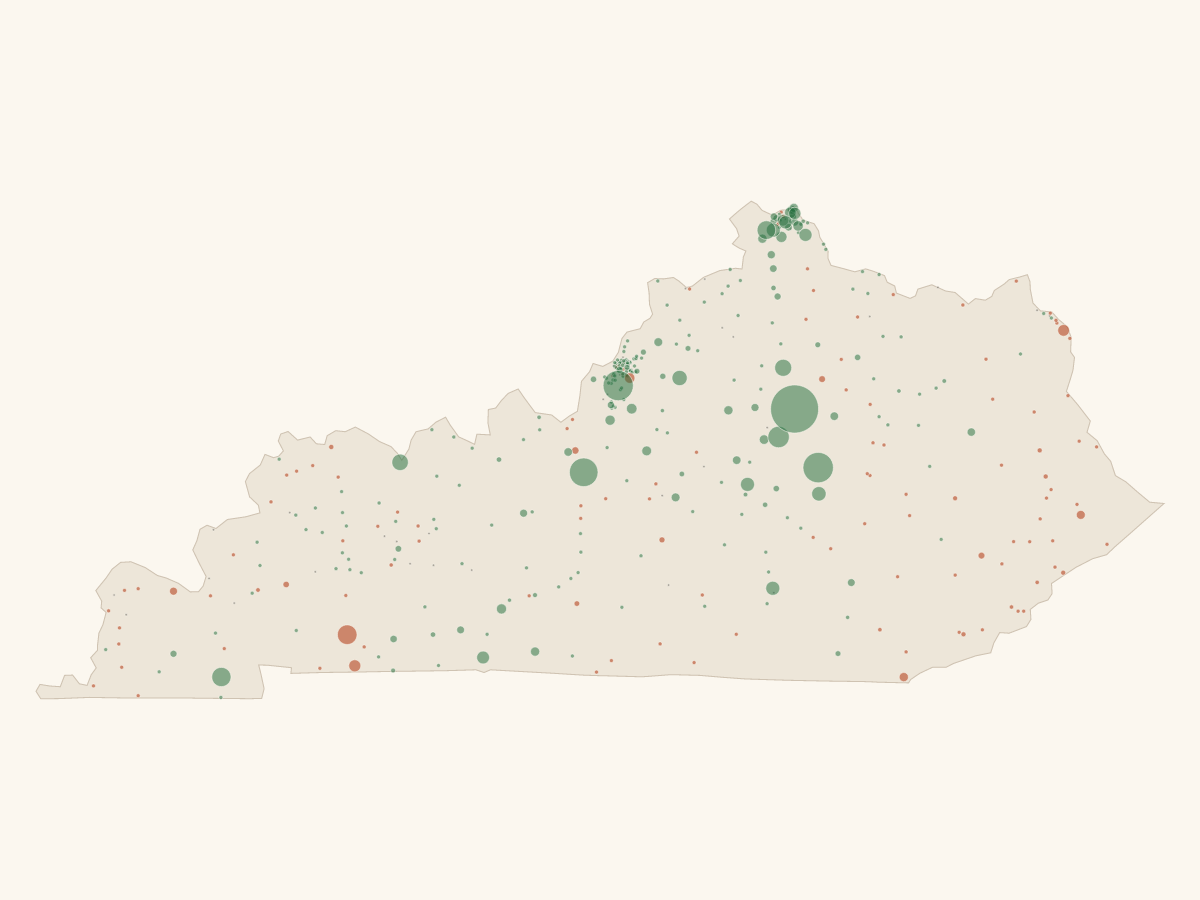
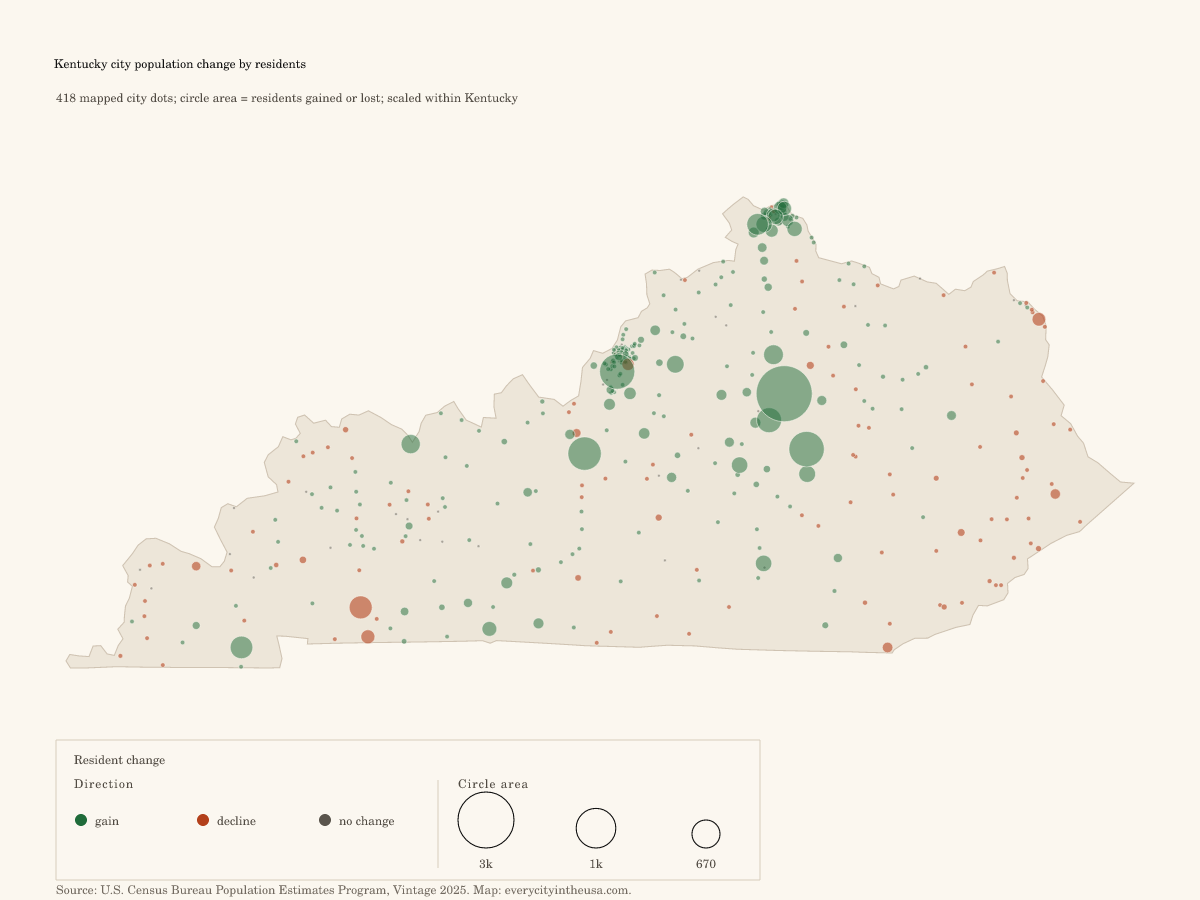
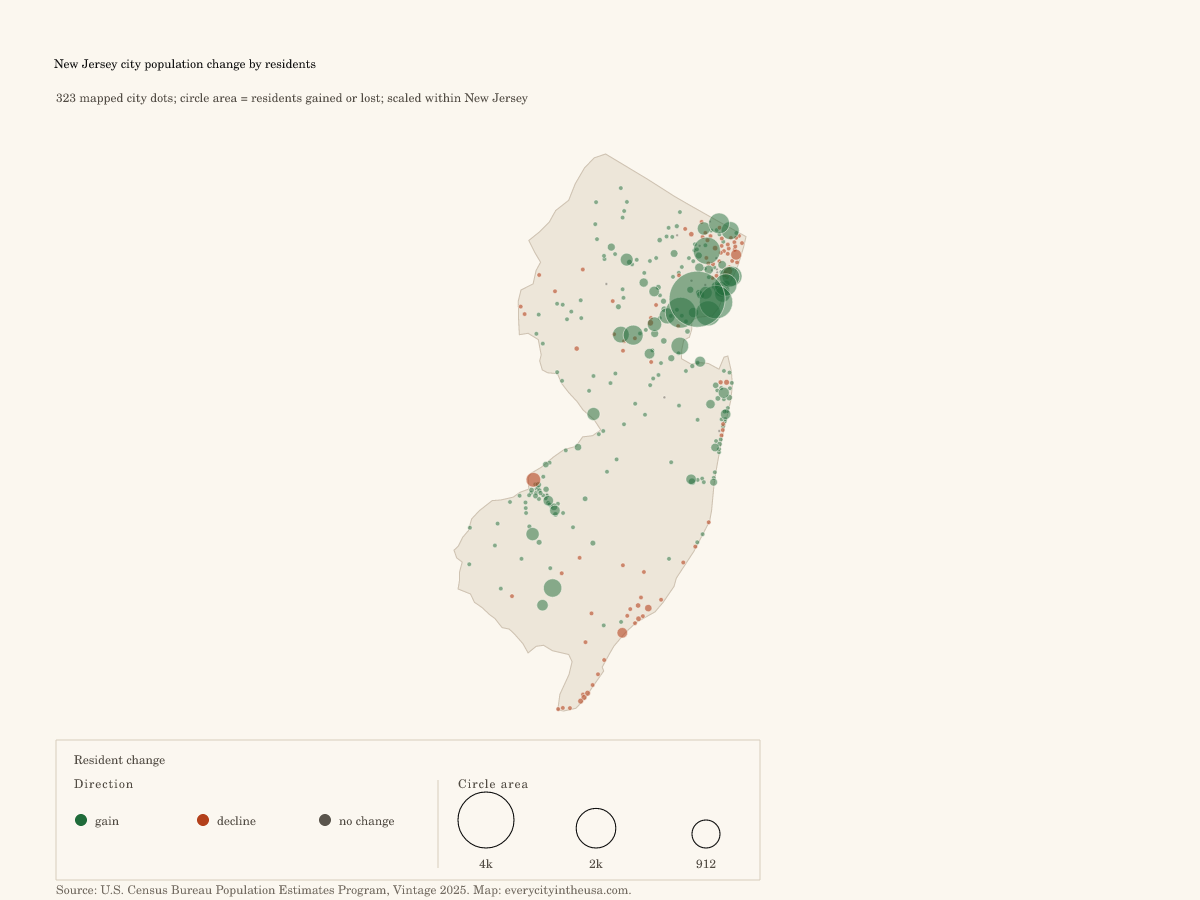
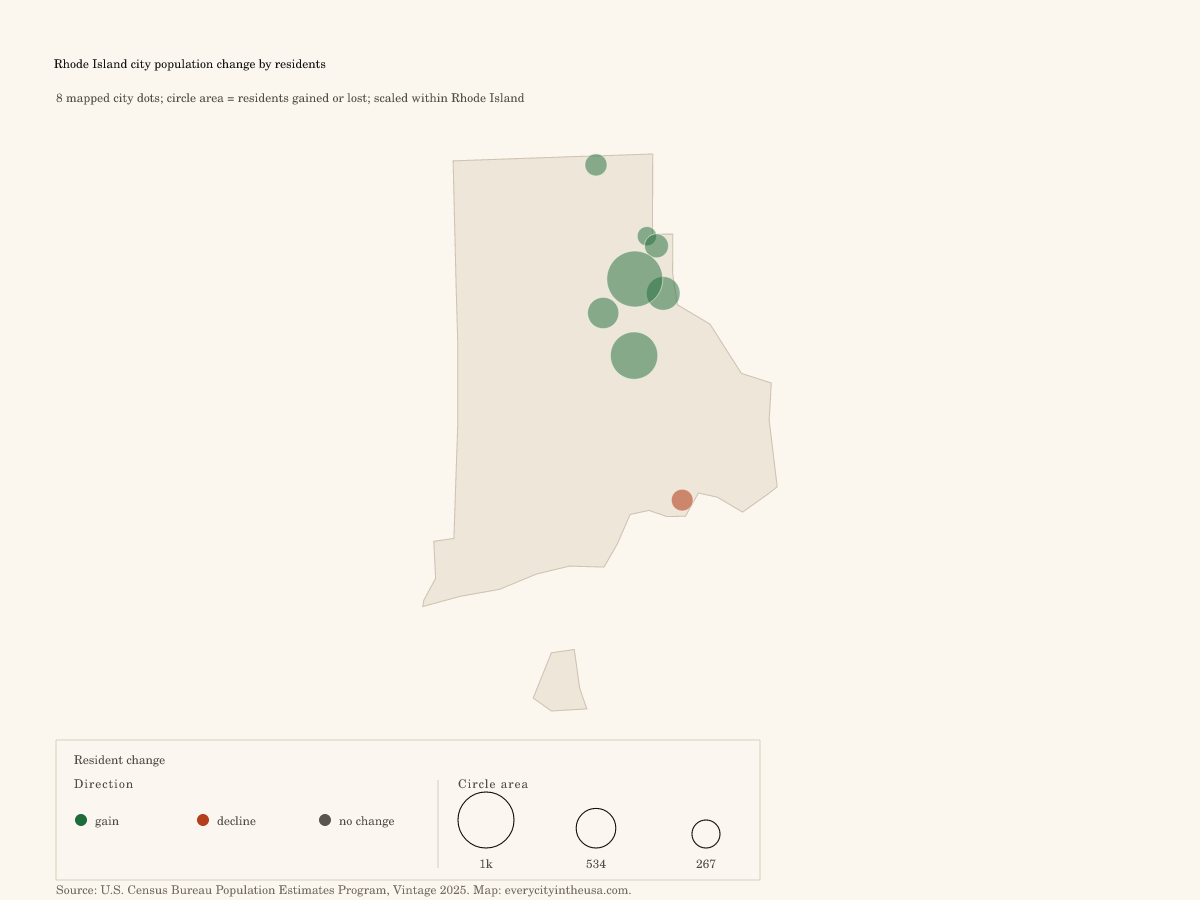
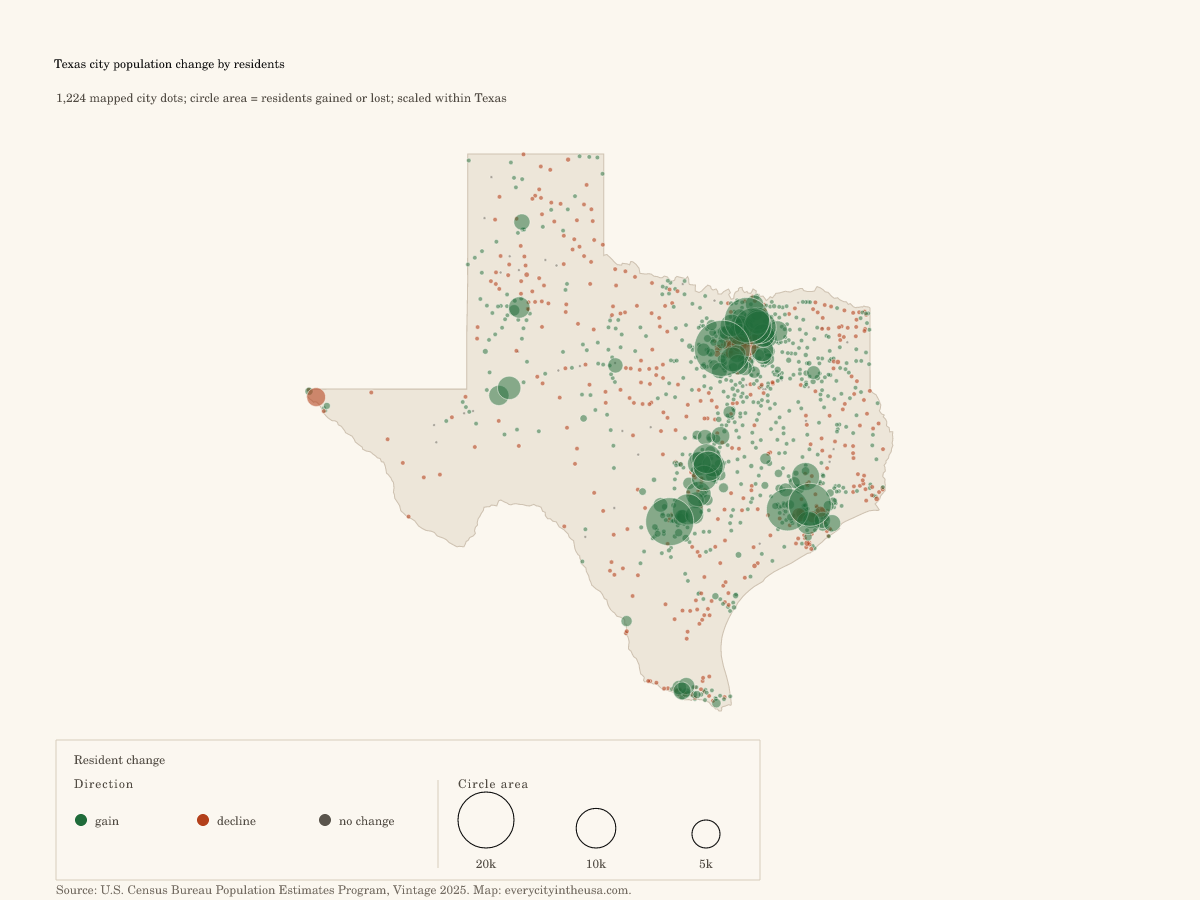
The resident-count map uses the same city dots and colors, but circle area shows the number of residents added or lost. Large cities and high absolute moves dominate this view, which is why it reads differently from the percentage map.
PercentageArea shows one-year percent change Small fast-moving cities become visible, including large percentage gains and losses. Resident countArea shows residents gained or lost Large cities and high absolute moves dominate this view.
Total population change includes births, deaths, and migration; it is not a net-migration measure.
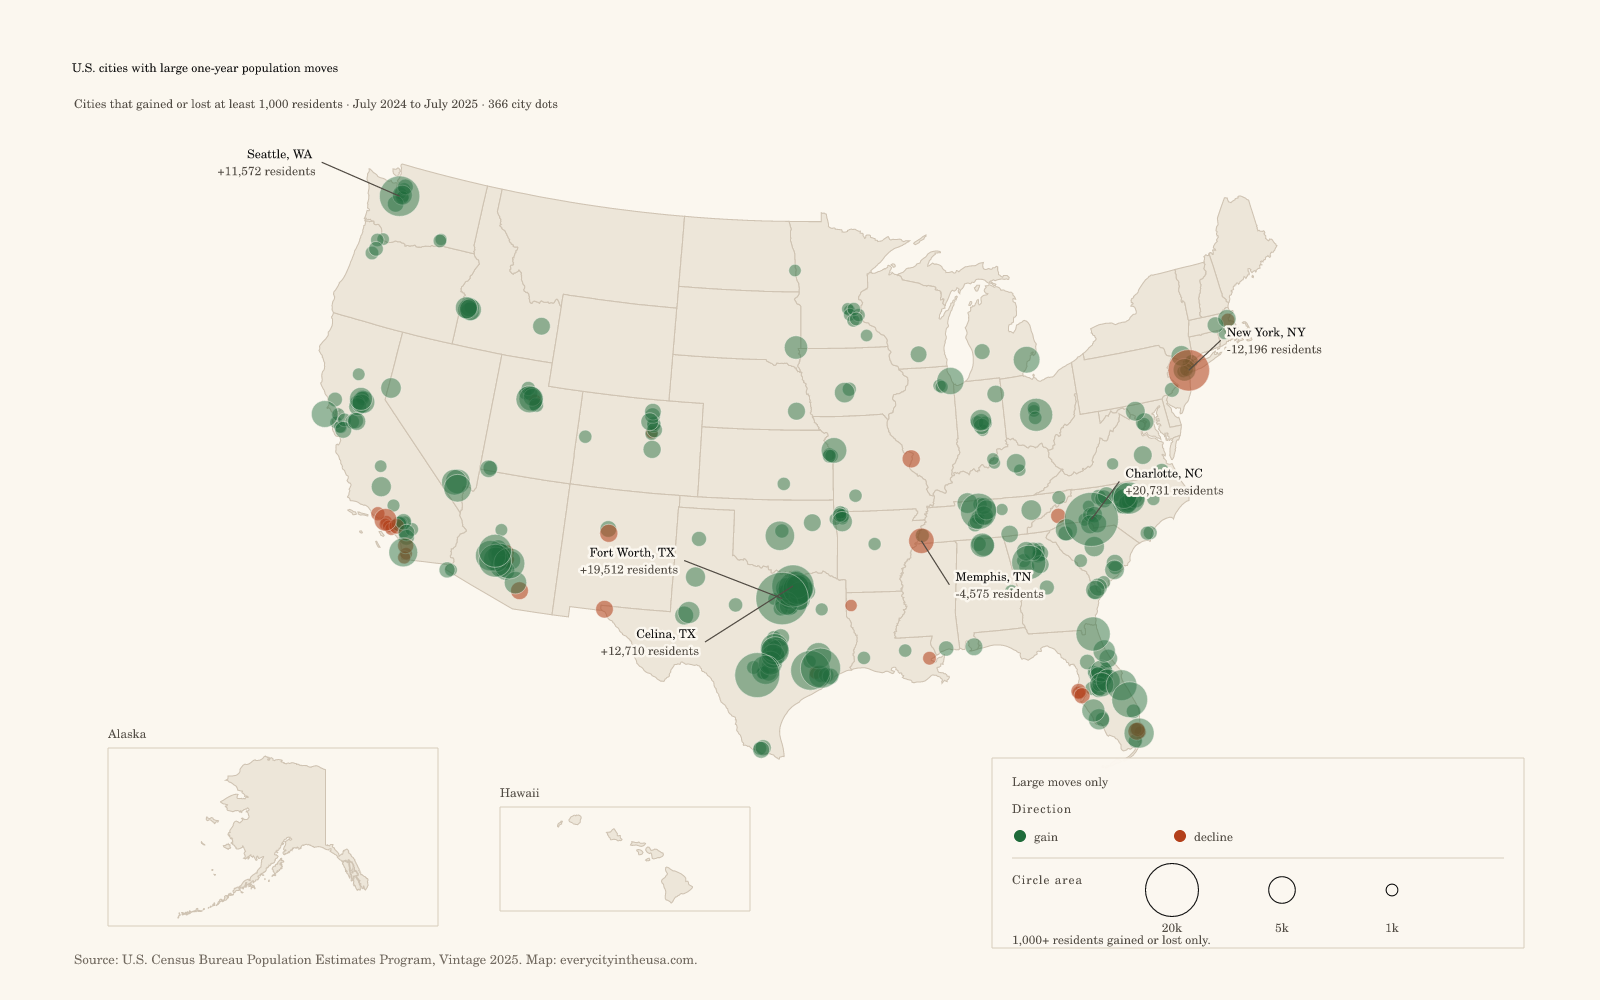
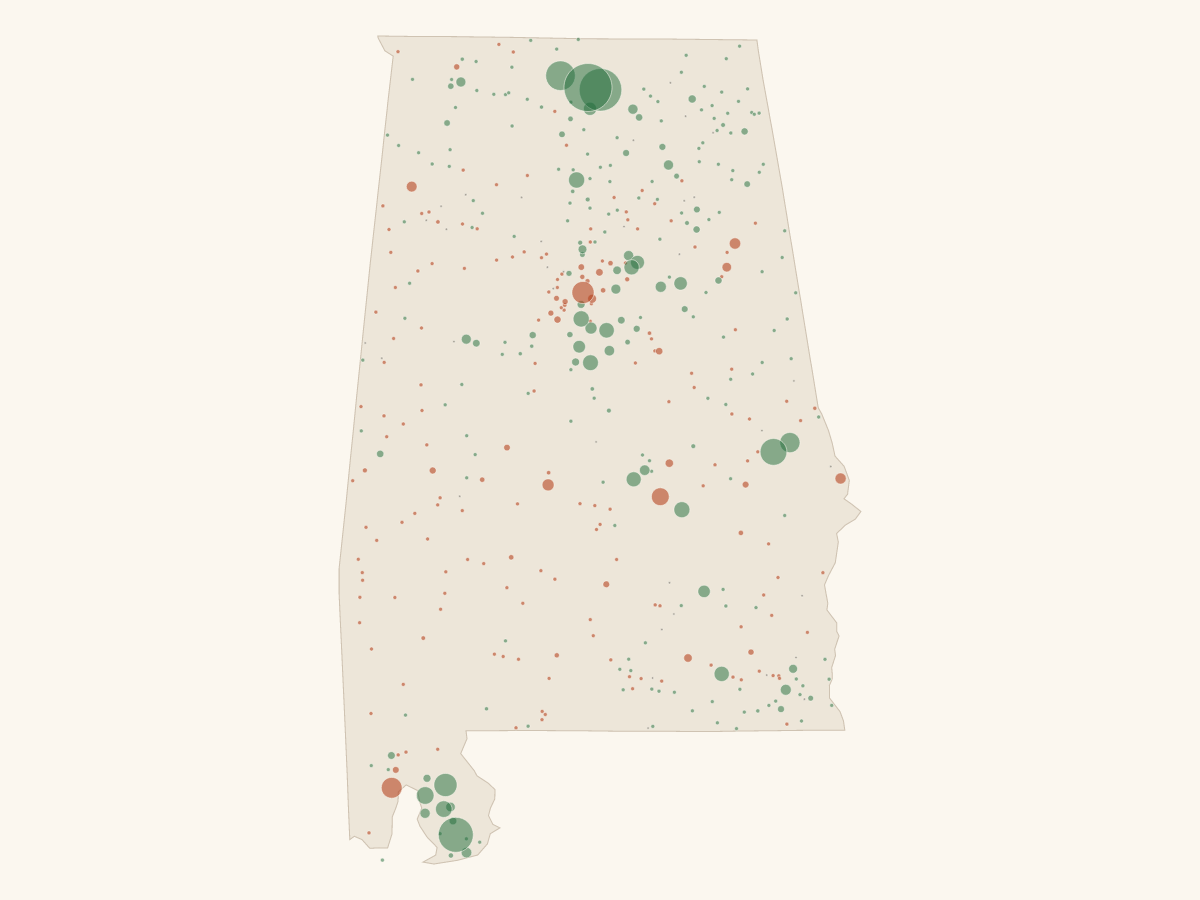
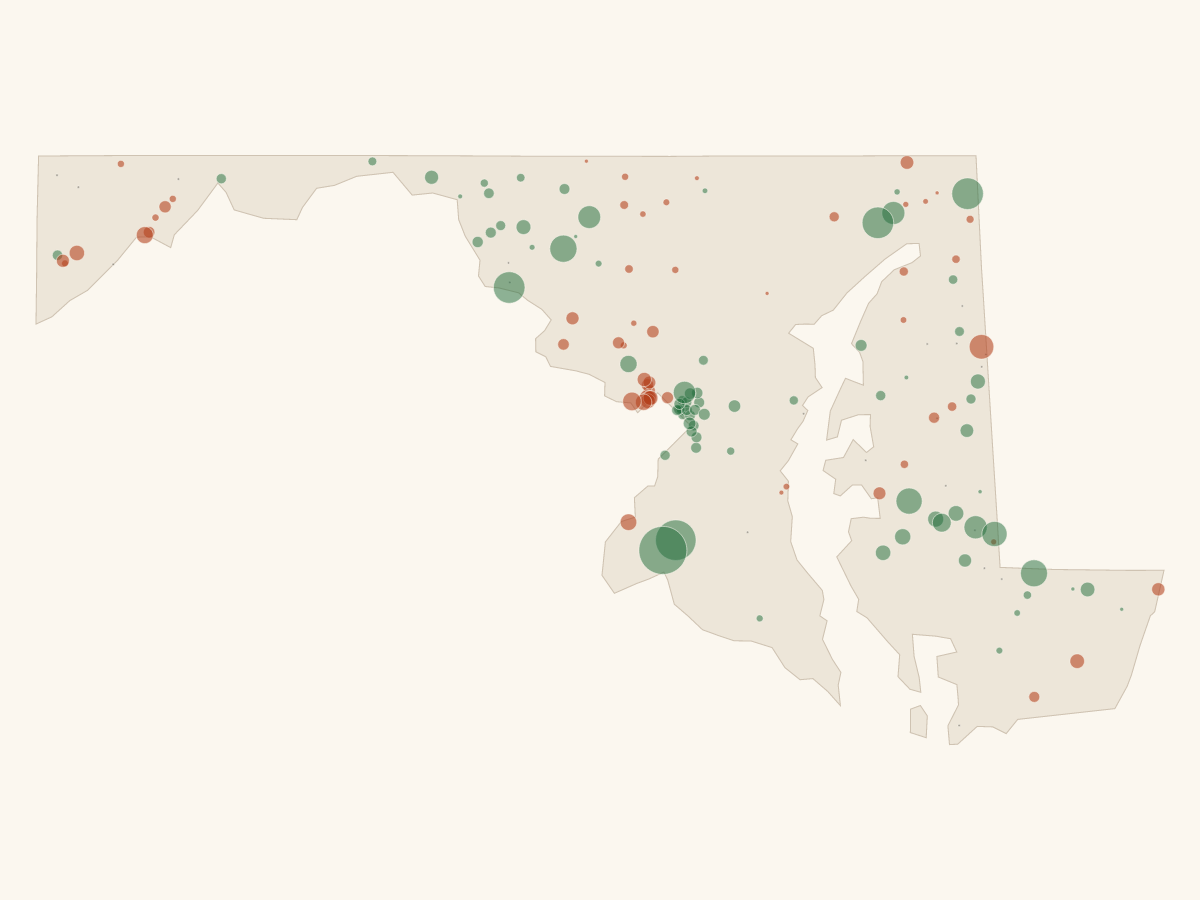
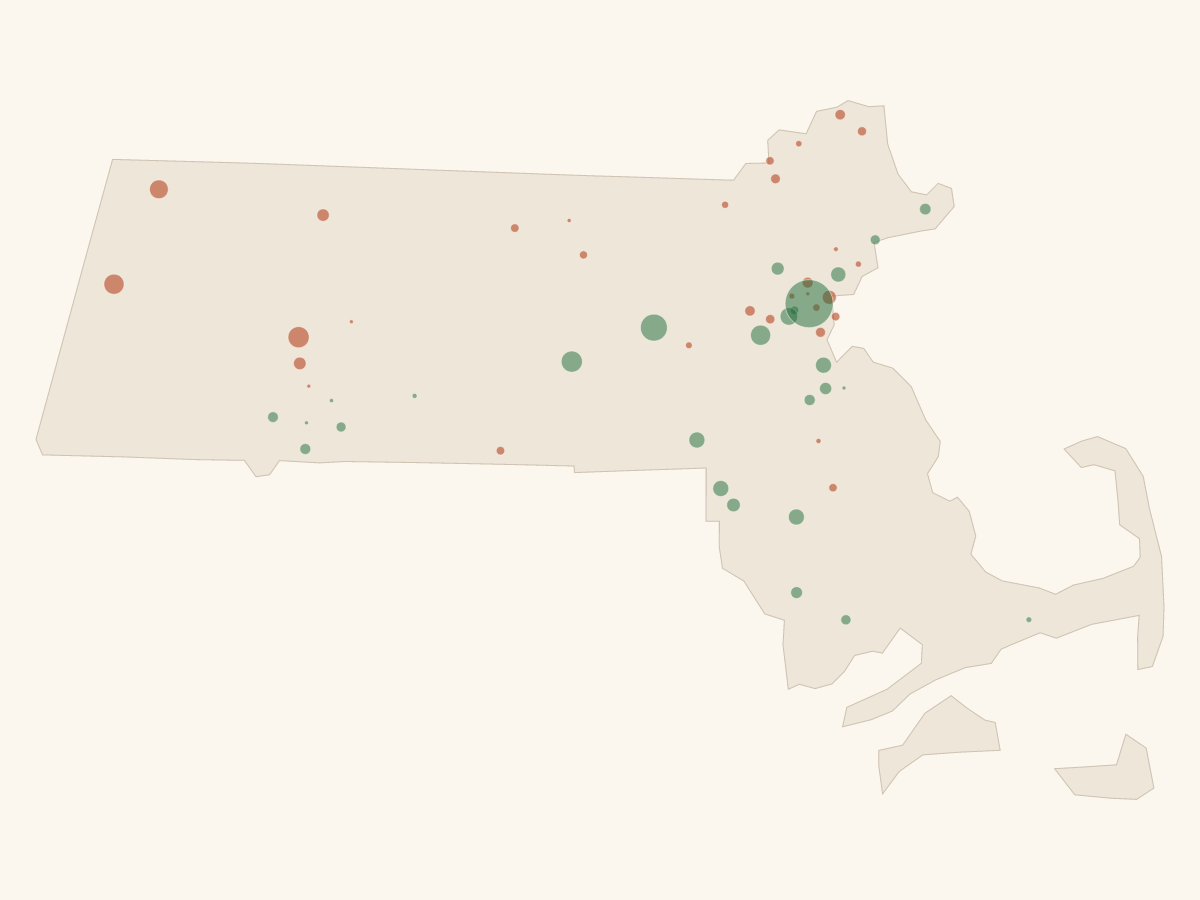
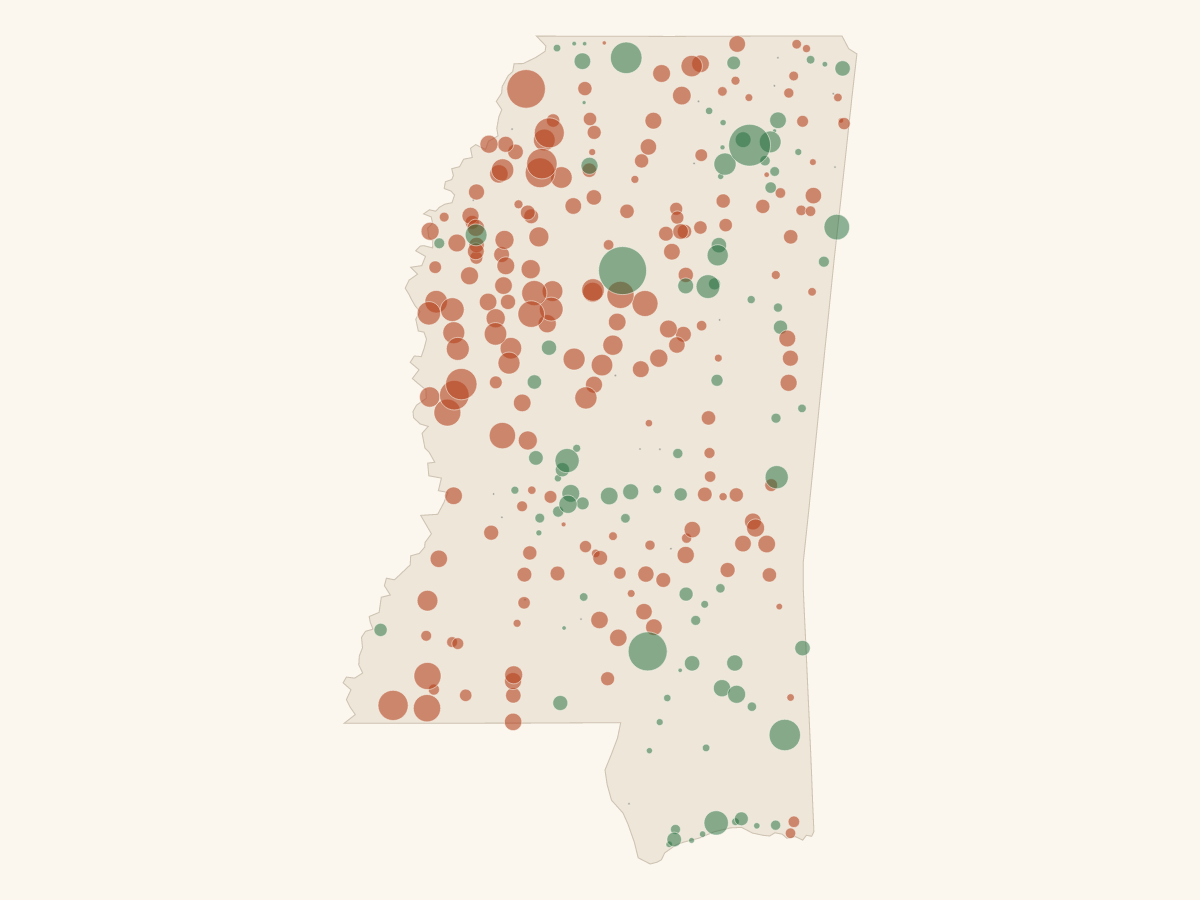
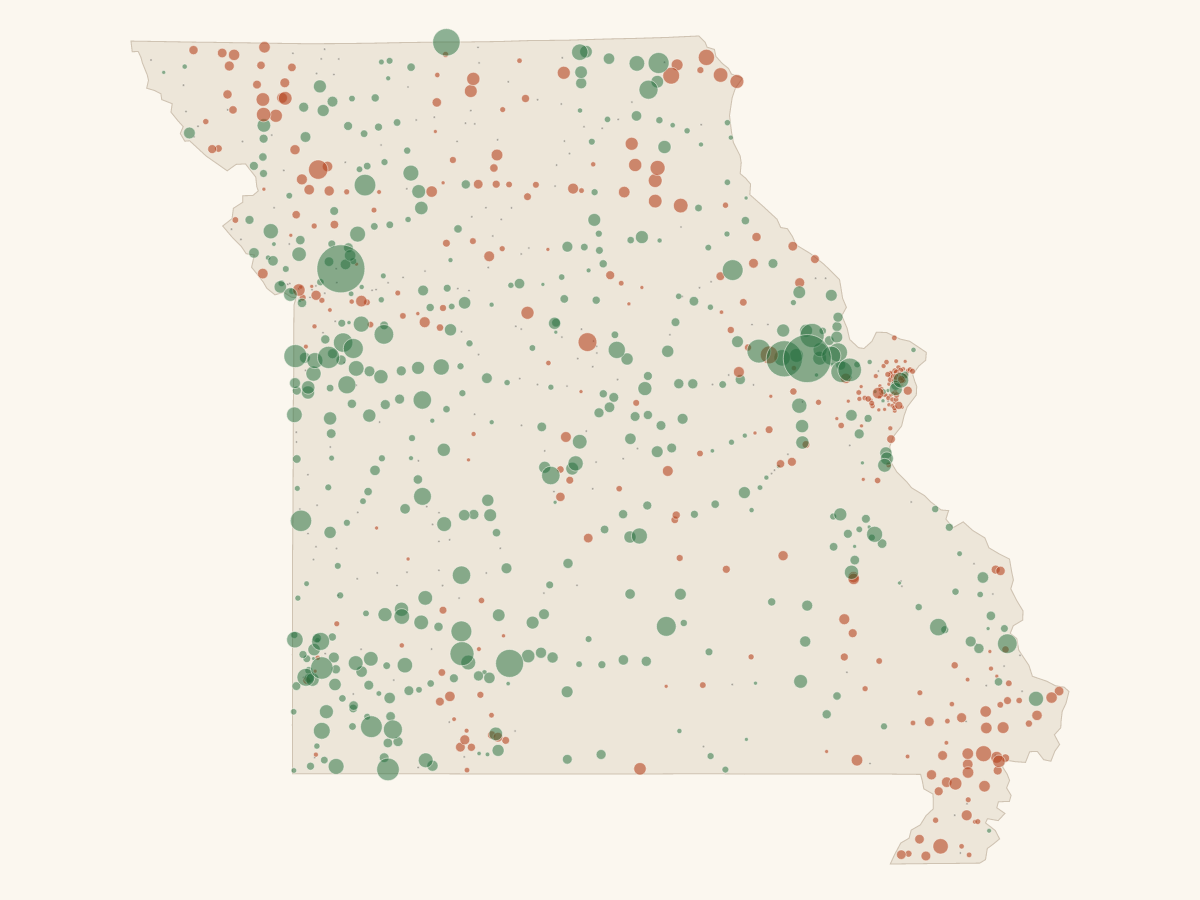
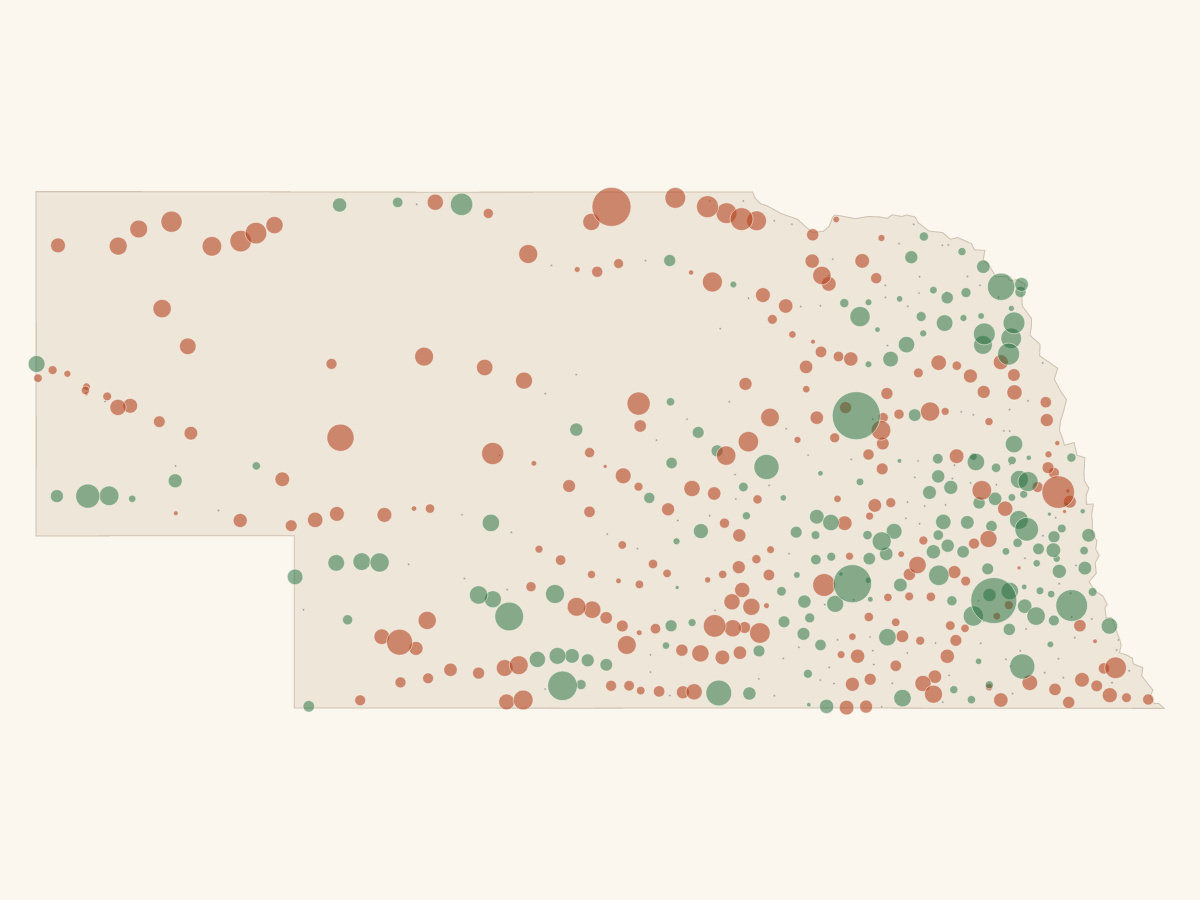
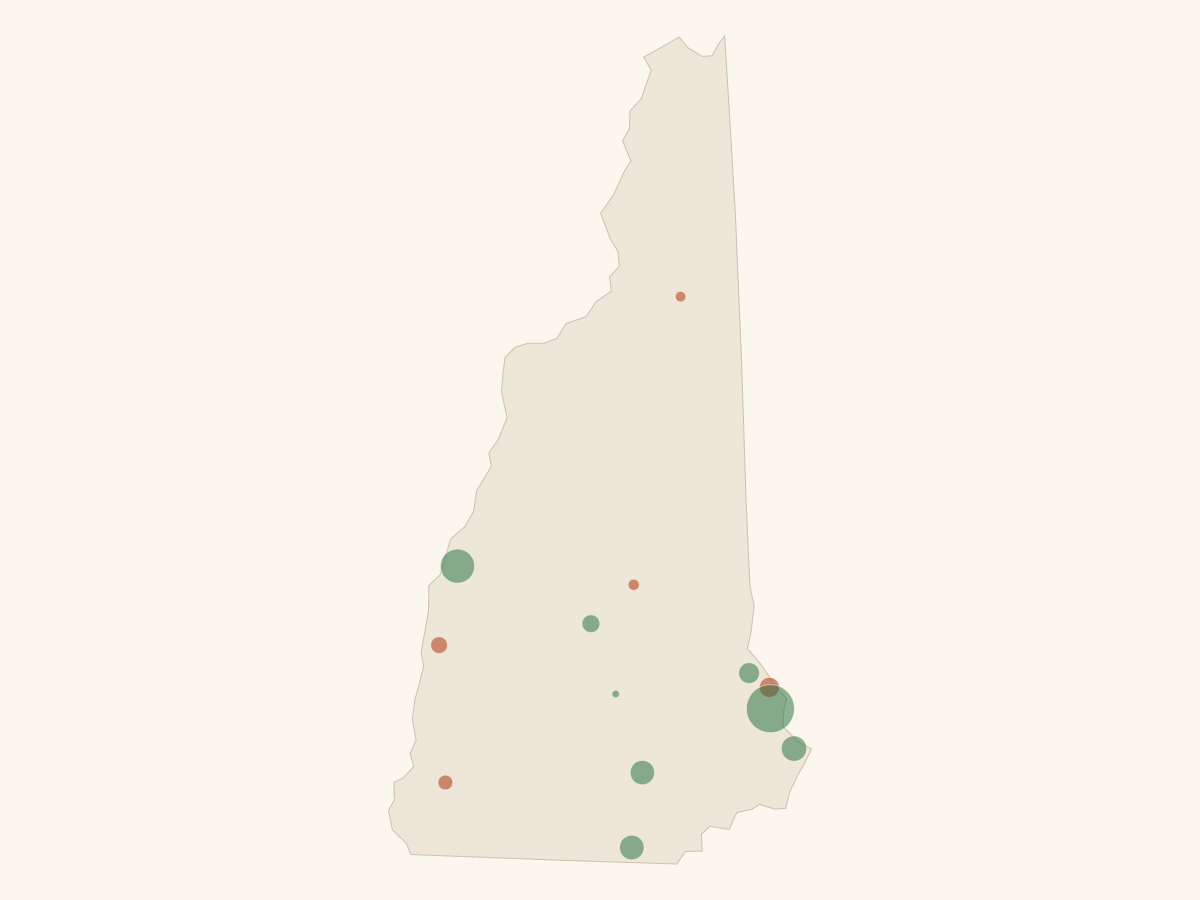
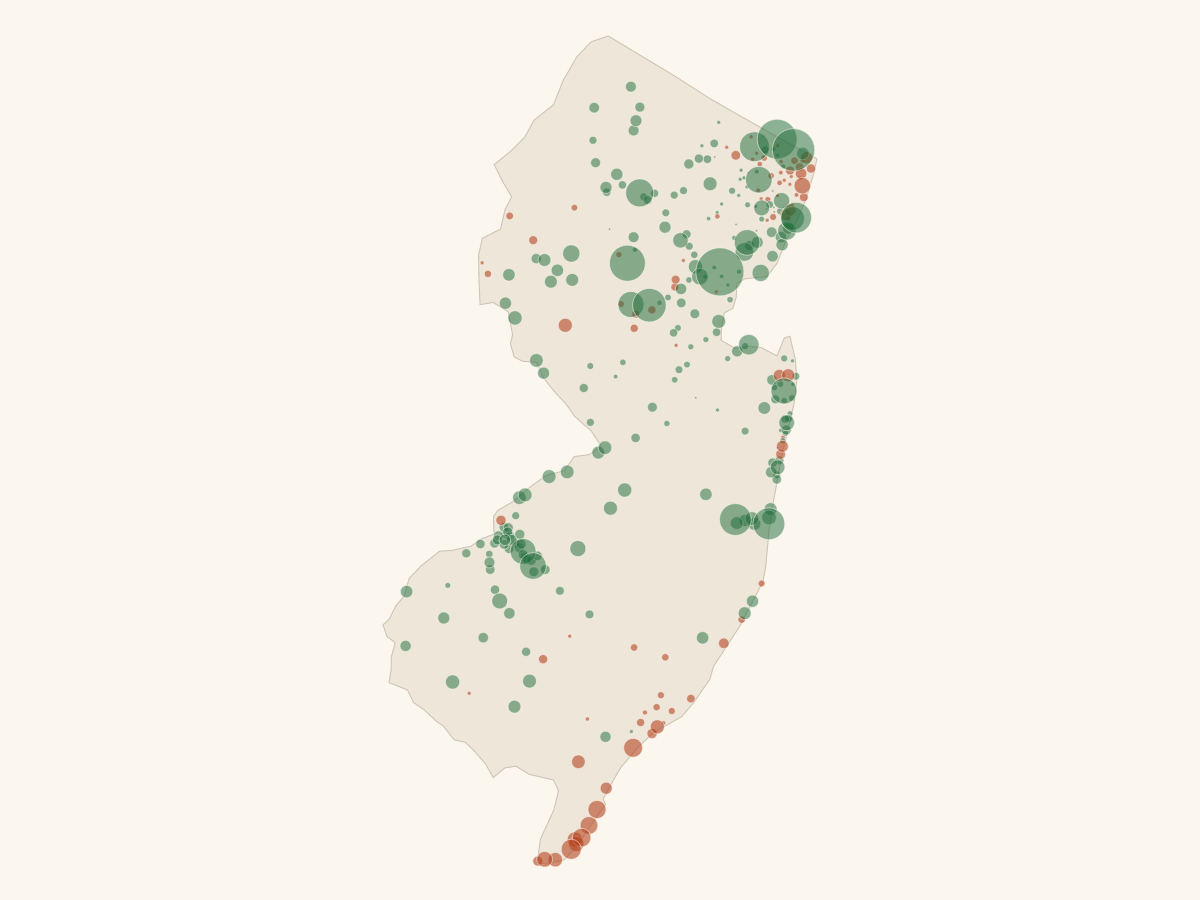
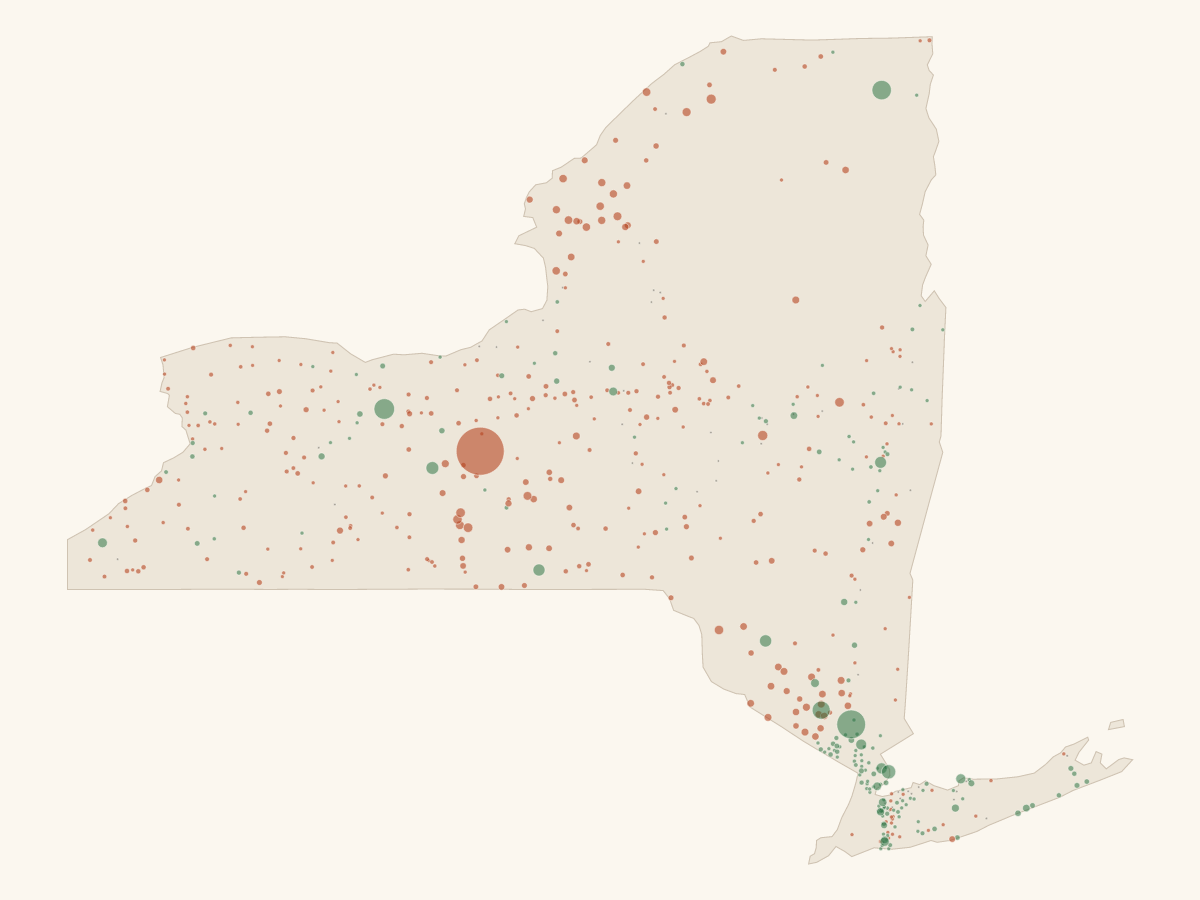
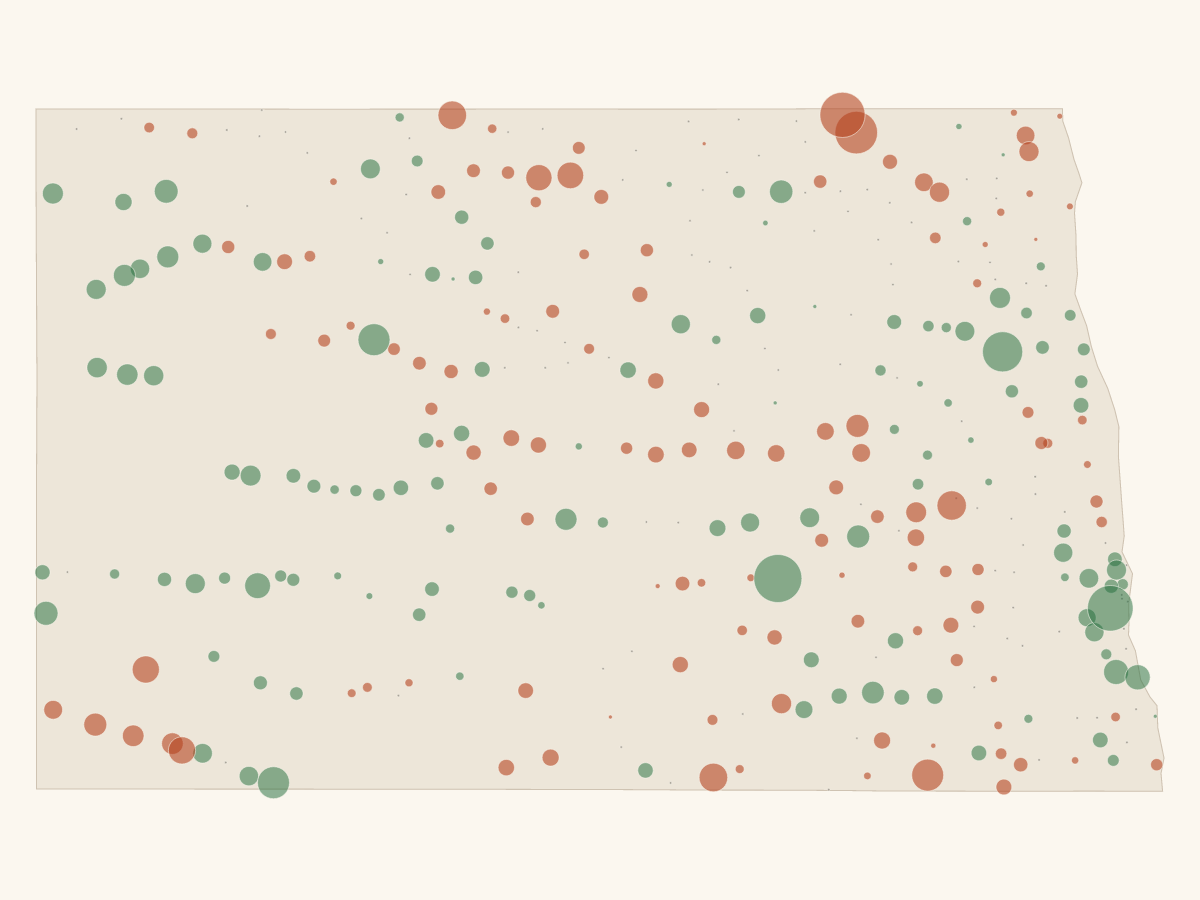
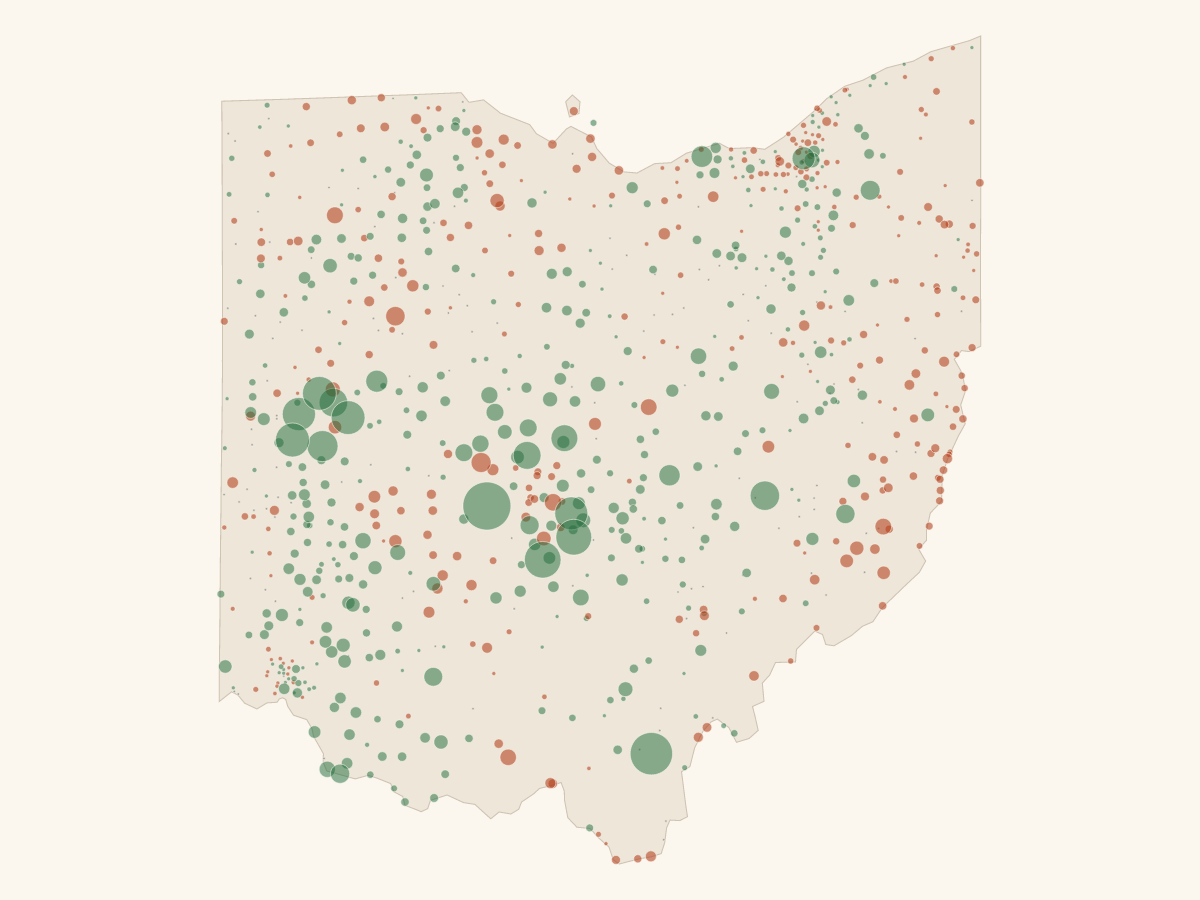
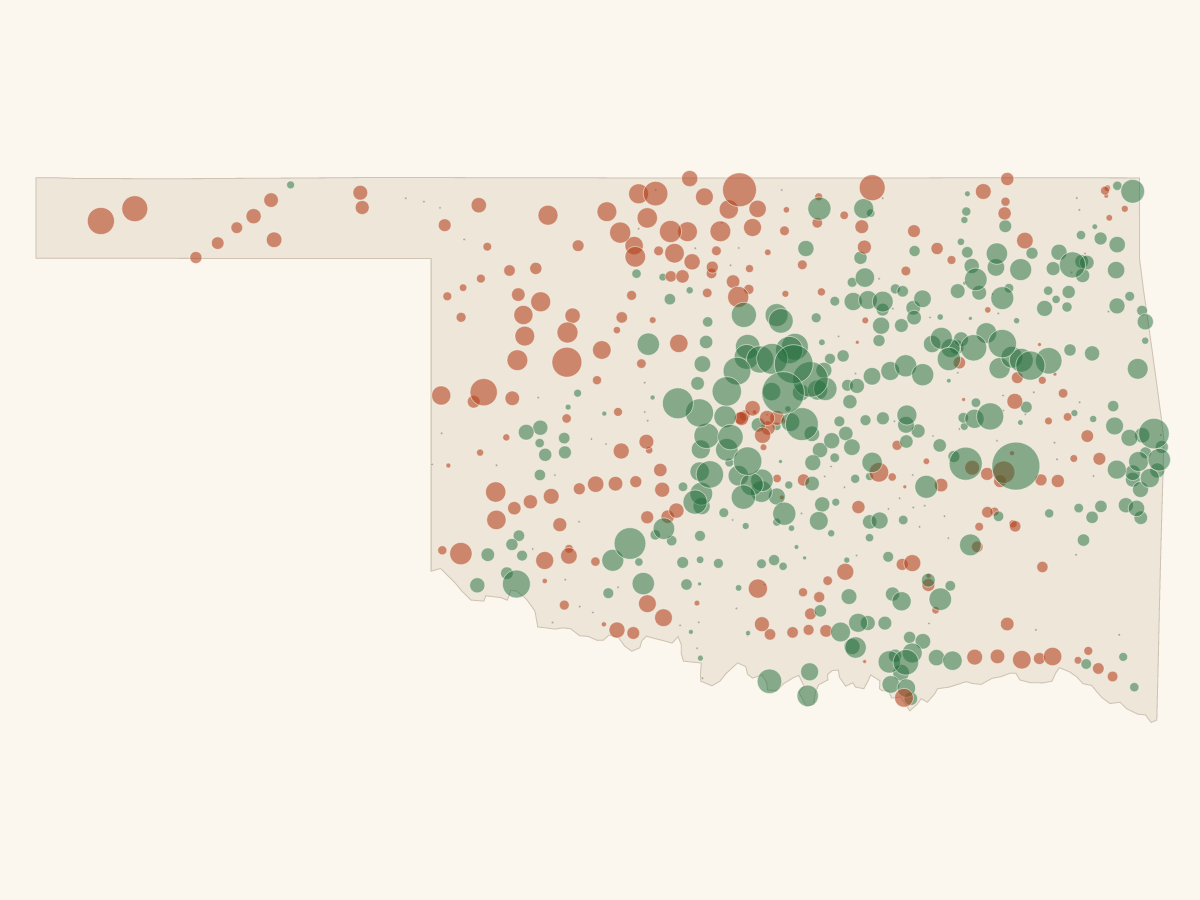
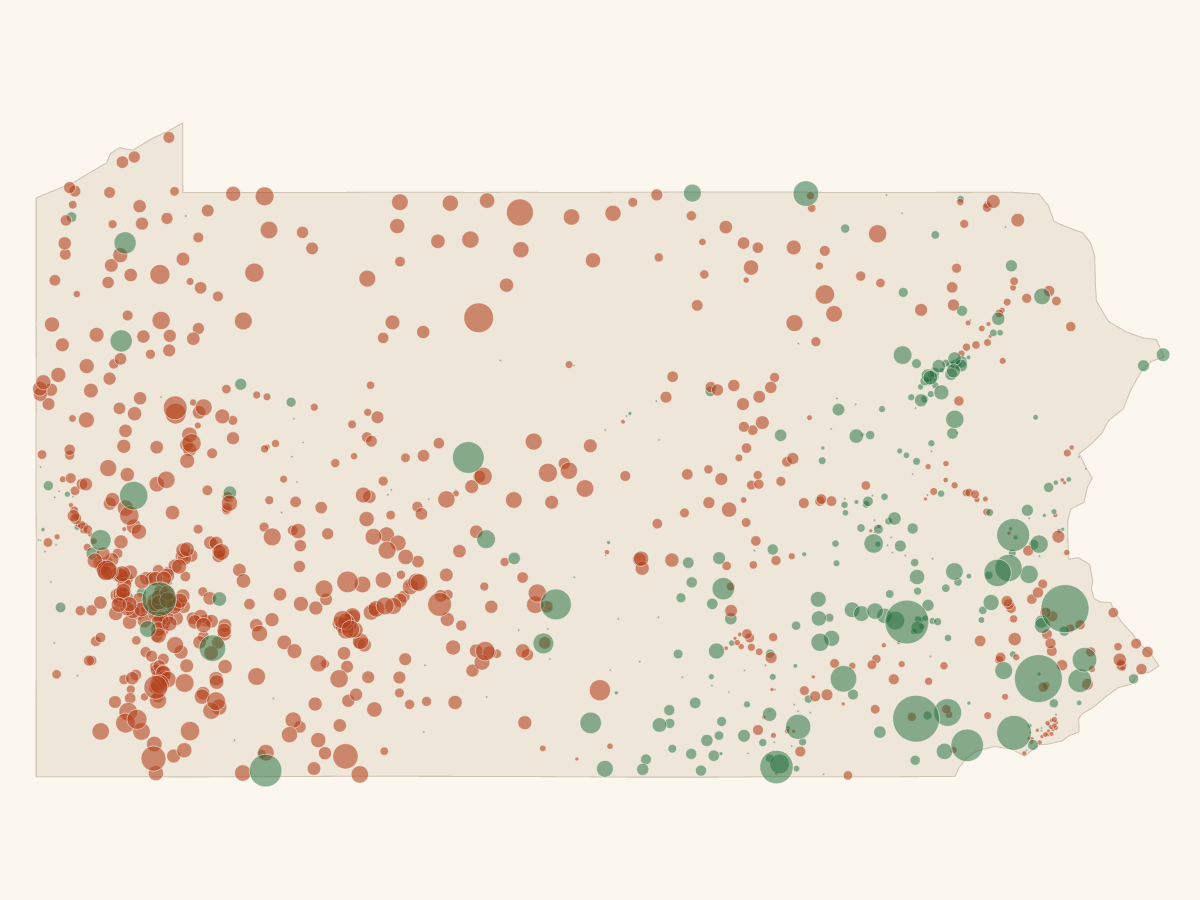
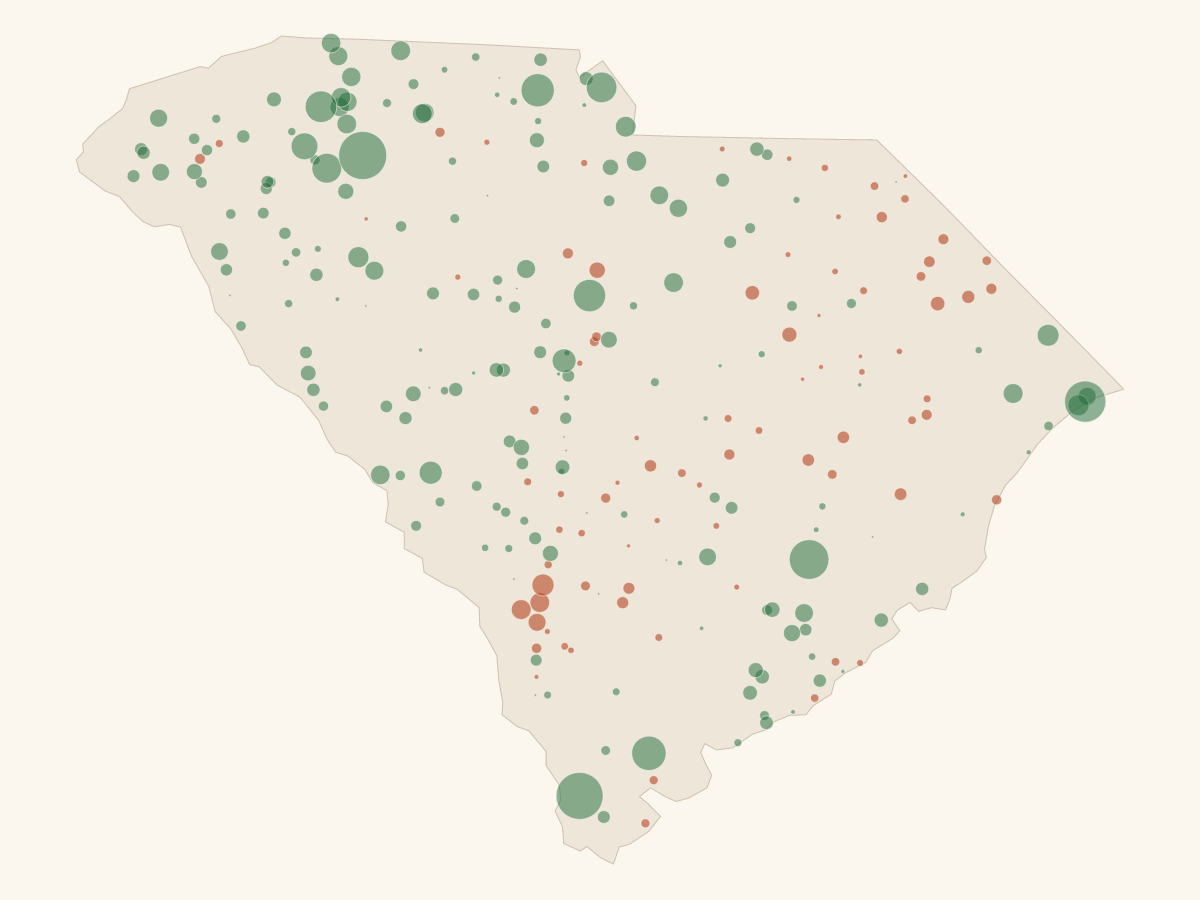
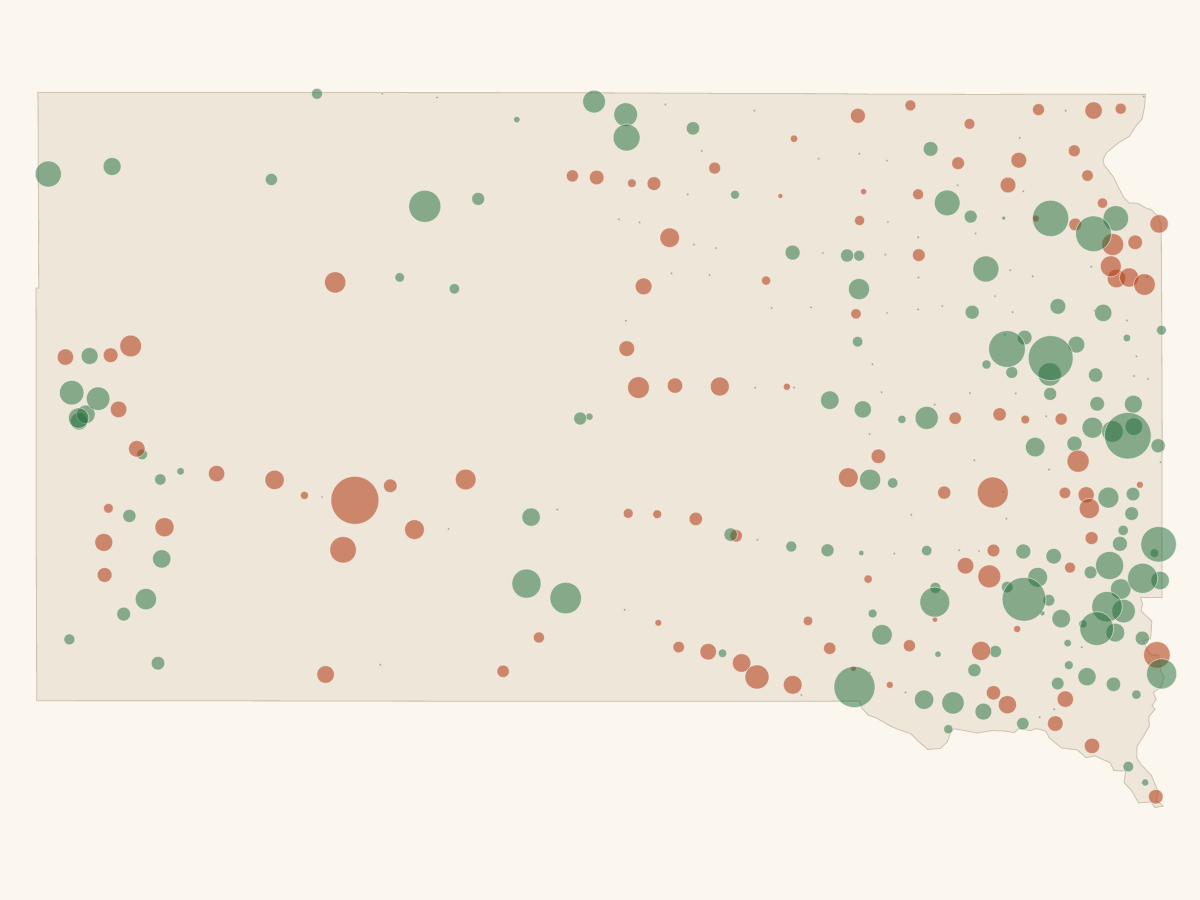
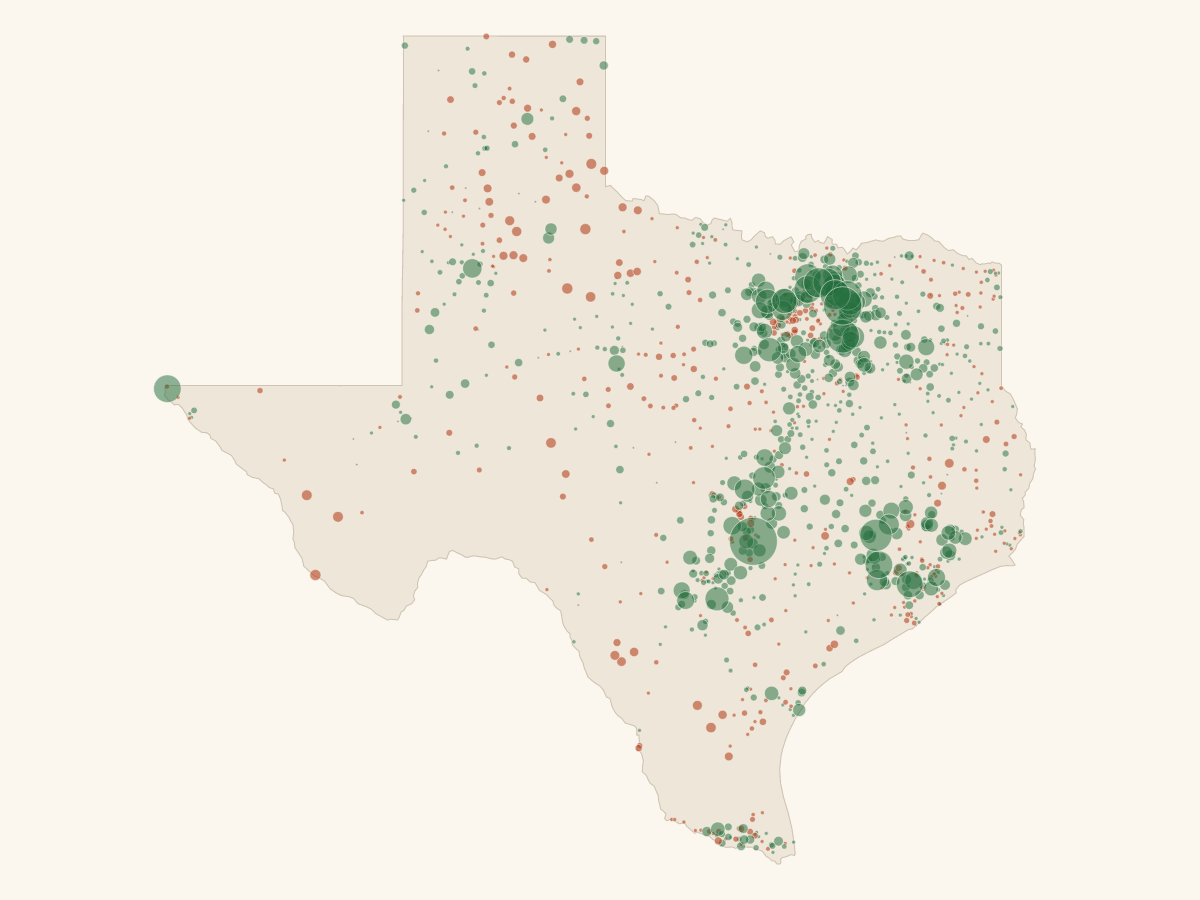
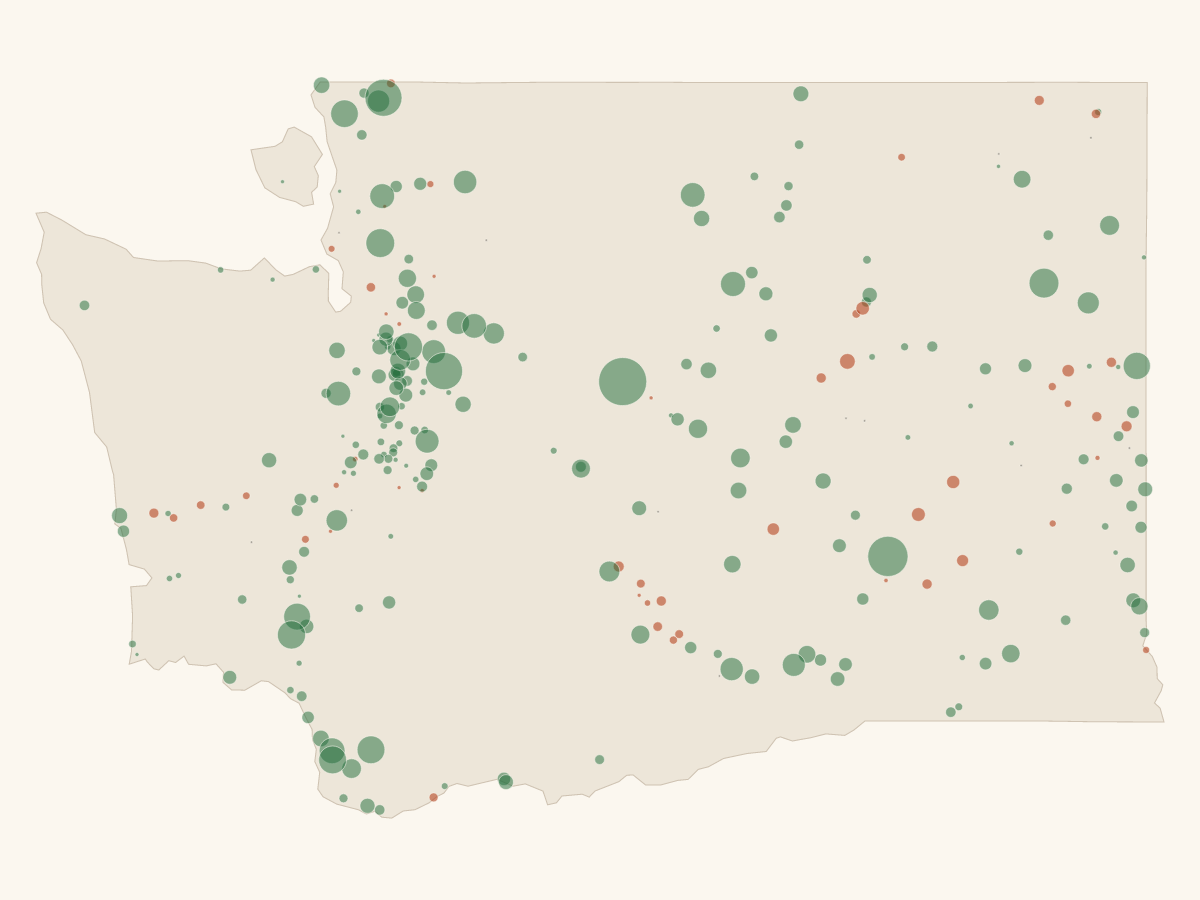
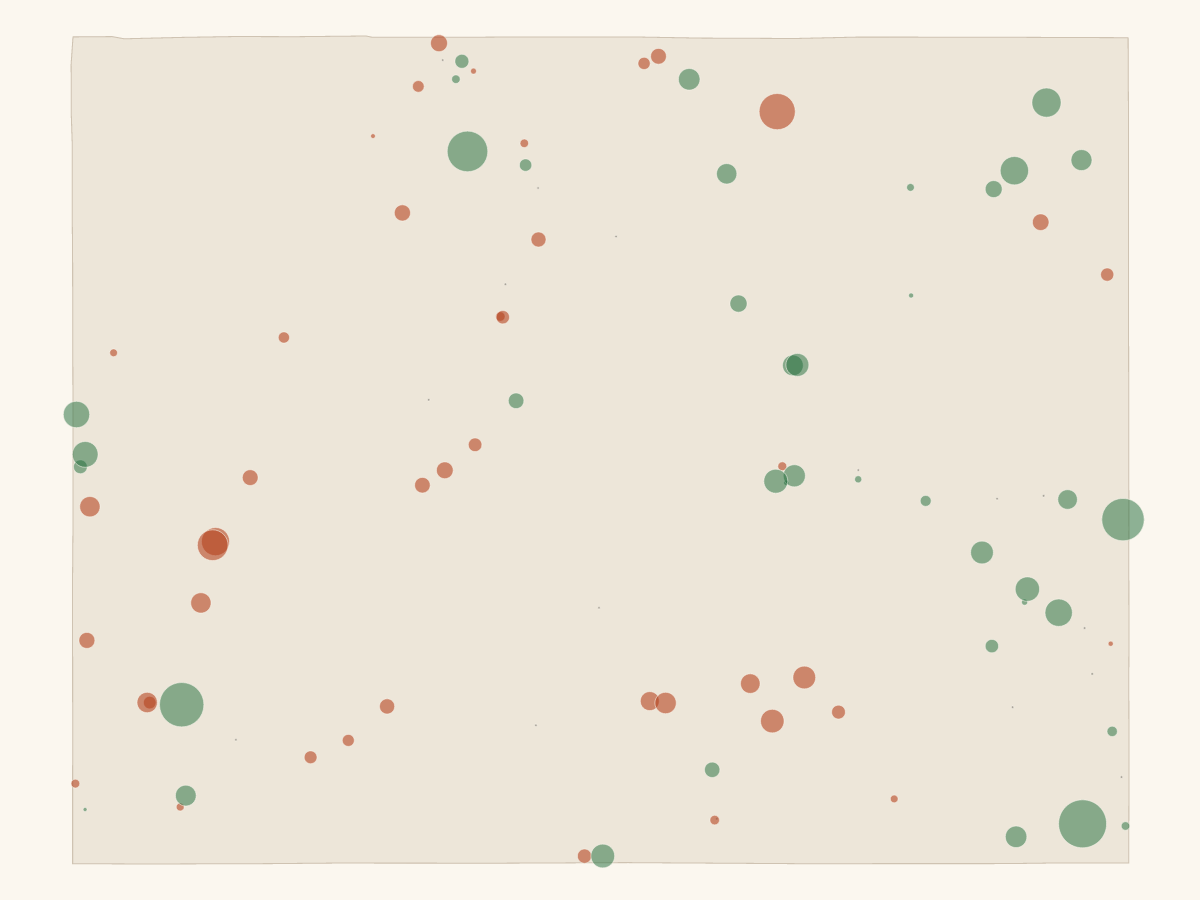
AnnotatedAll-city gain/loss map Every mapped city: green gain, rust decline, gray no one-year change SVGPNG16:9 cleanContiguous U.S. hero map 16:9 clean crop with no labels, legend, Alaska, or Hawaii SVGPNG1200x630Contiguous U.S. social map 1200 by 630 clean crop for social cards and article thumbnails SVGPNG1:1 cleanContiguous U.S. square map Square clean crop for embeds and social variants SVGPNGGainsGainers emphasis map Population gains highlighted; flat and declining cities shown as gray context SVGPNGDeclinesDeclines emphasis map Population declines highlighted; flat and growing cities shown as gray context SVGPNG1k+ movesLarge moves map Only cities that gained or lost at least 1,000 residents from 2024 to 2025 SVGPNG
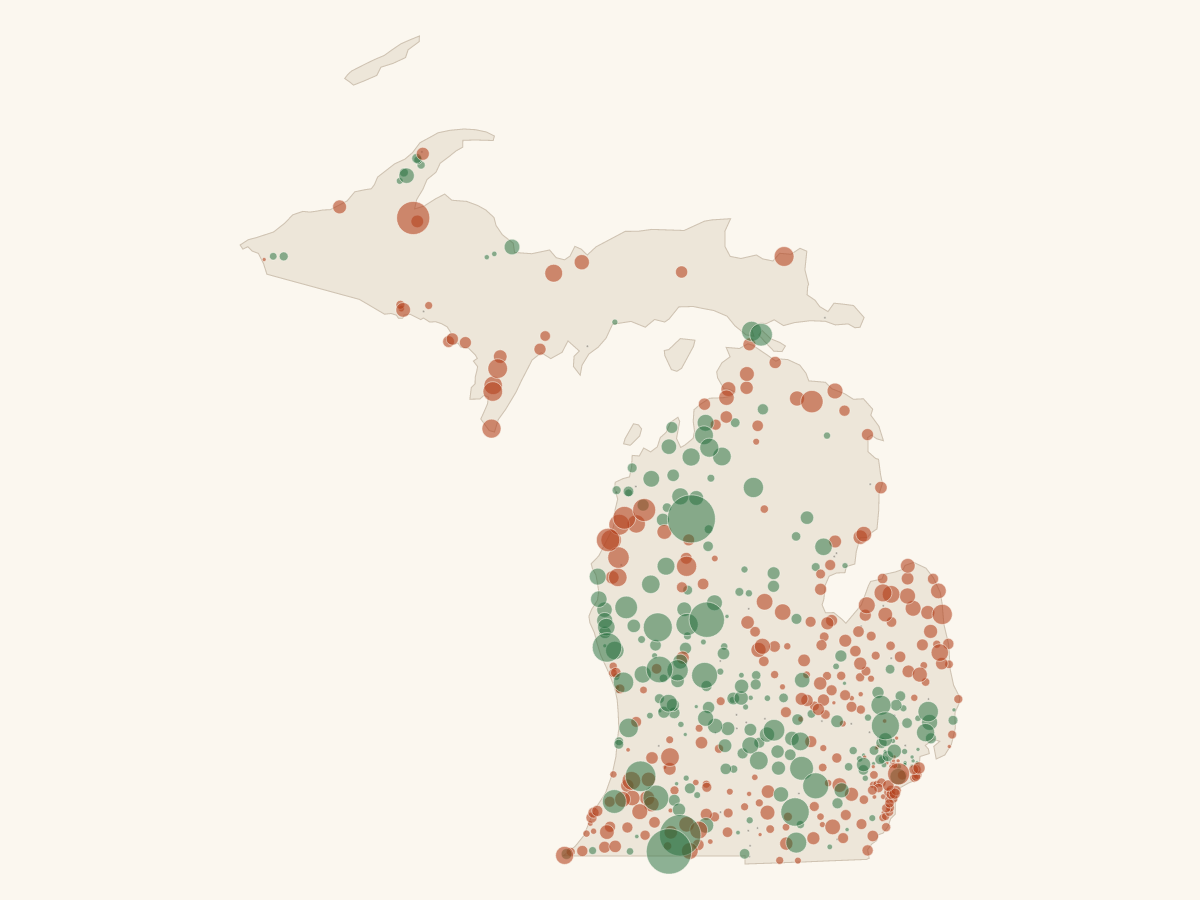
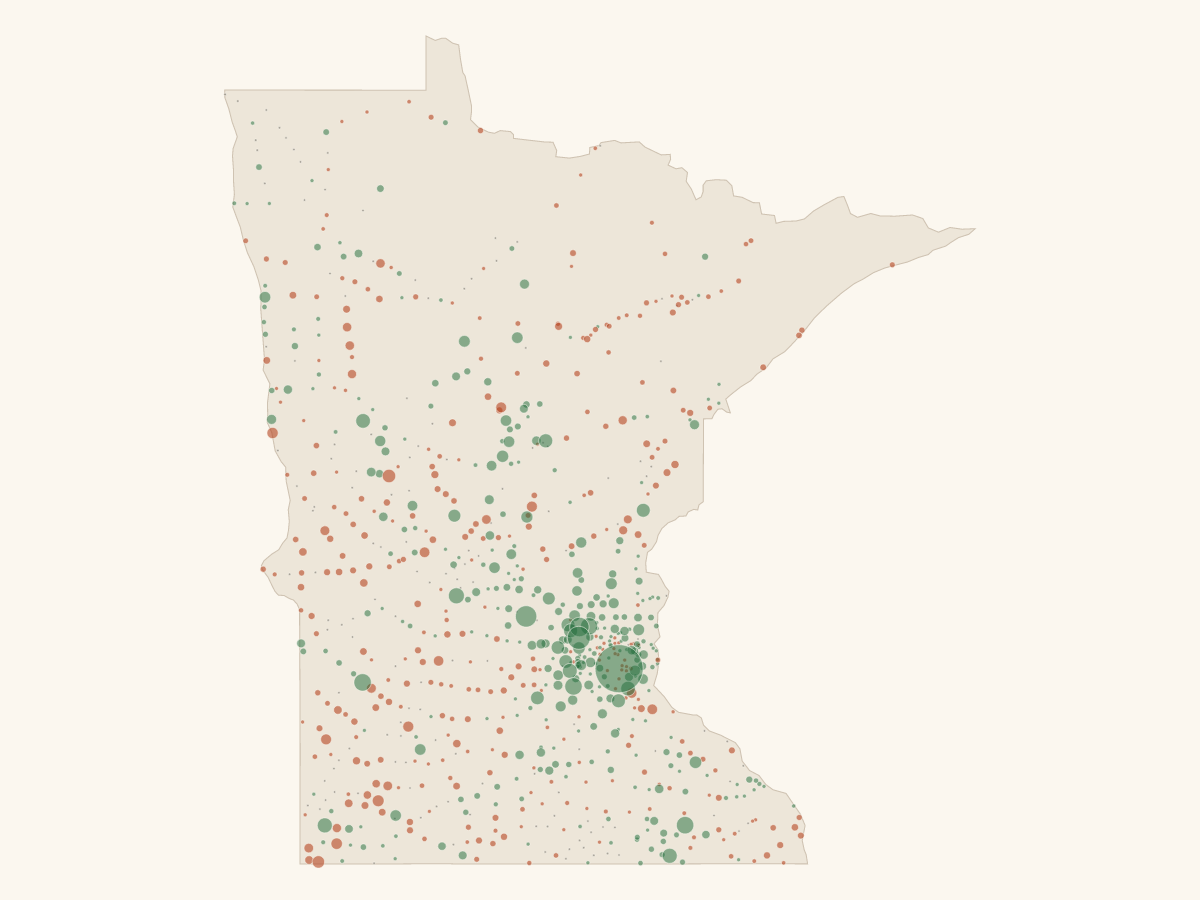
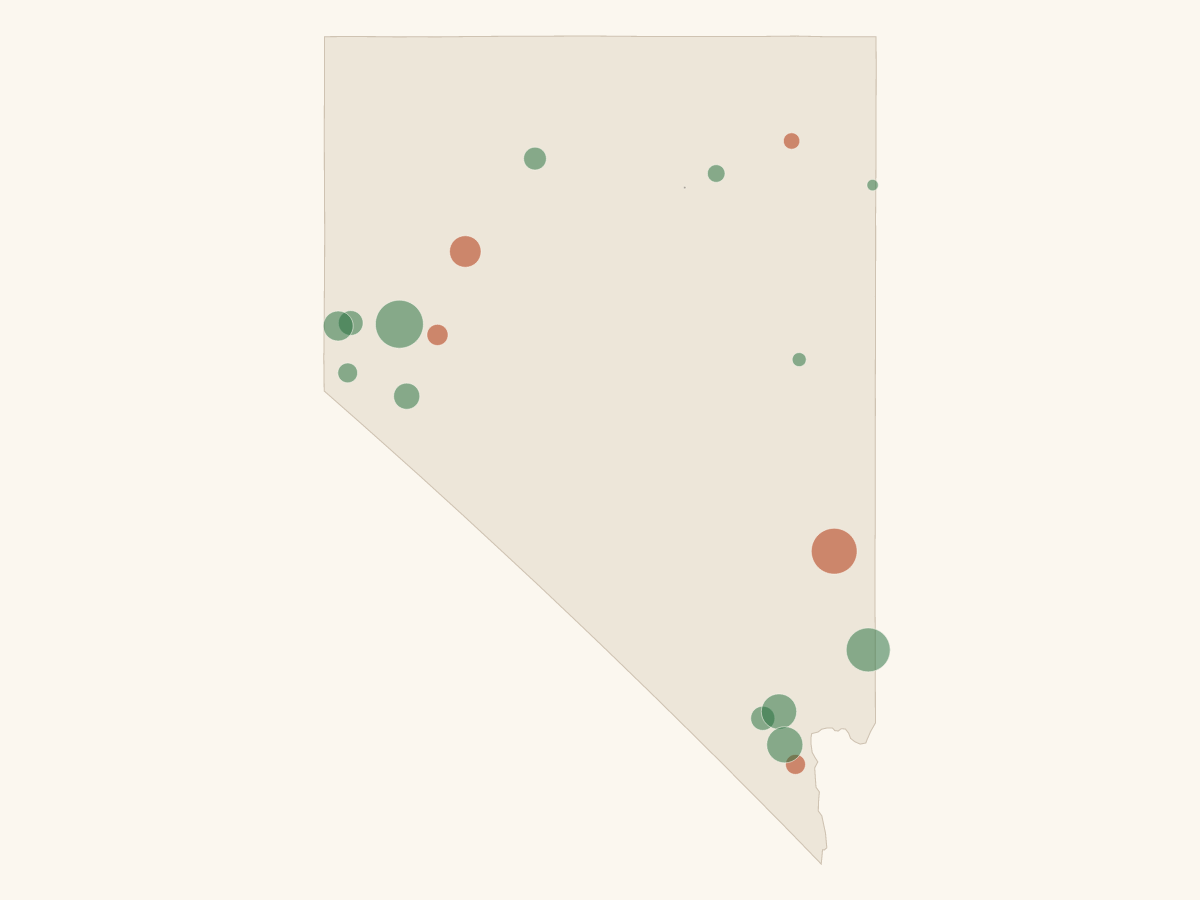
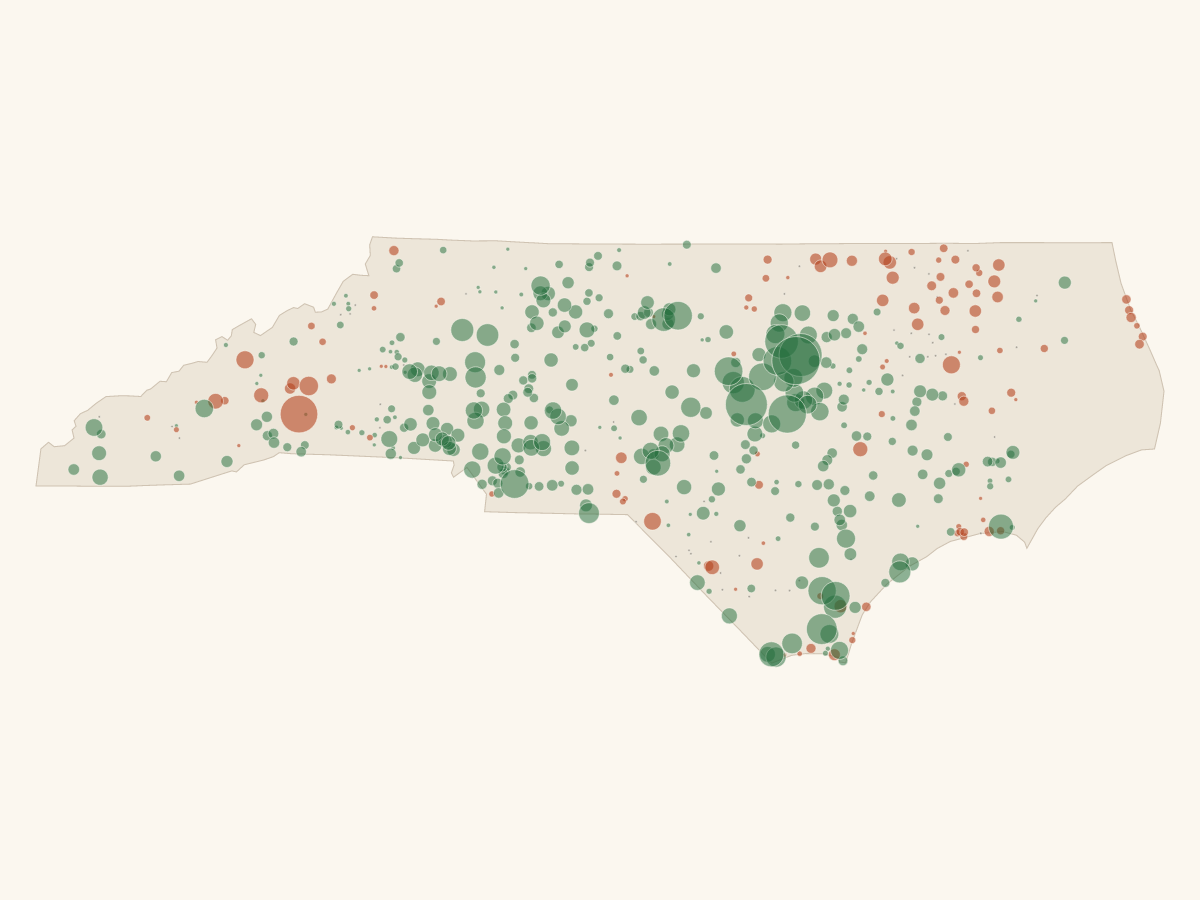
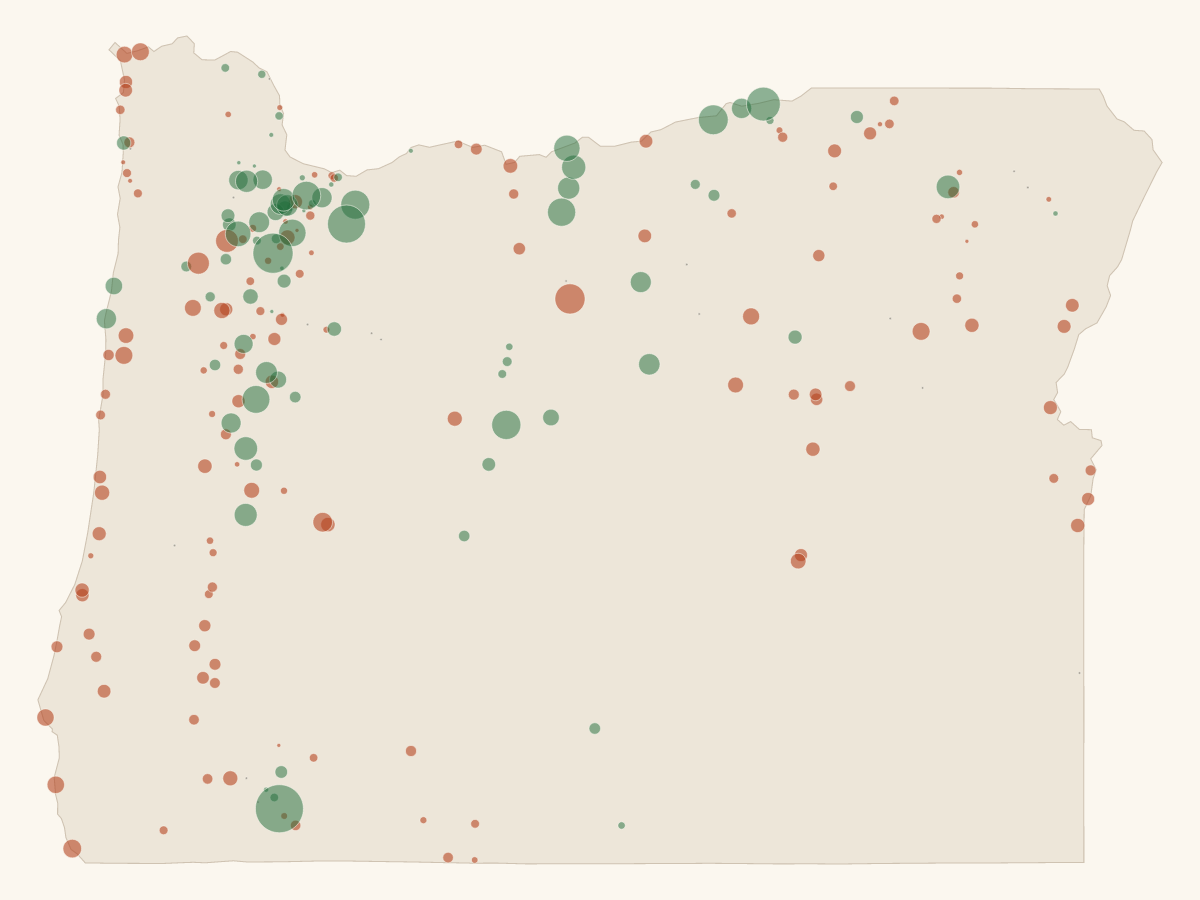
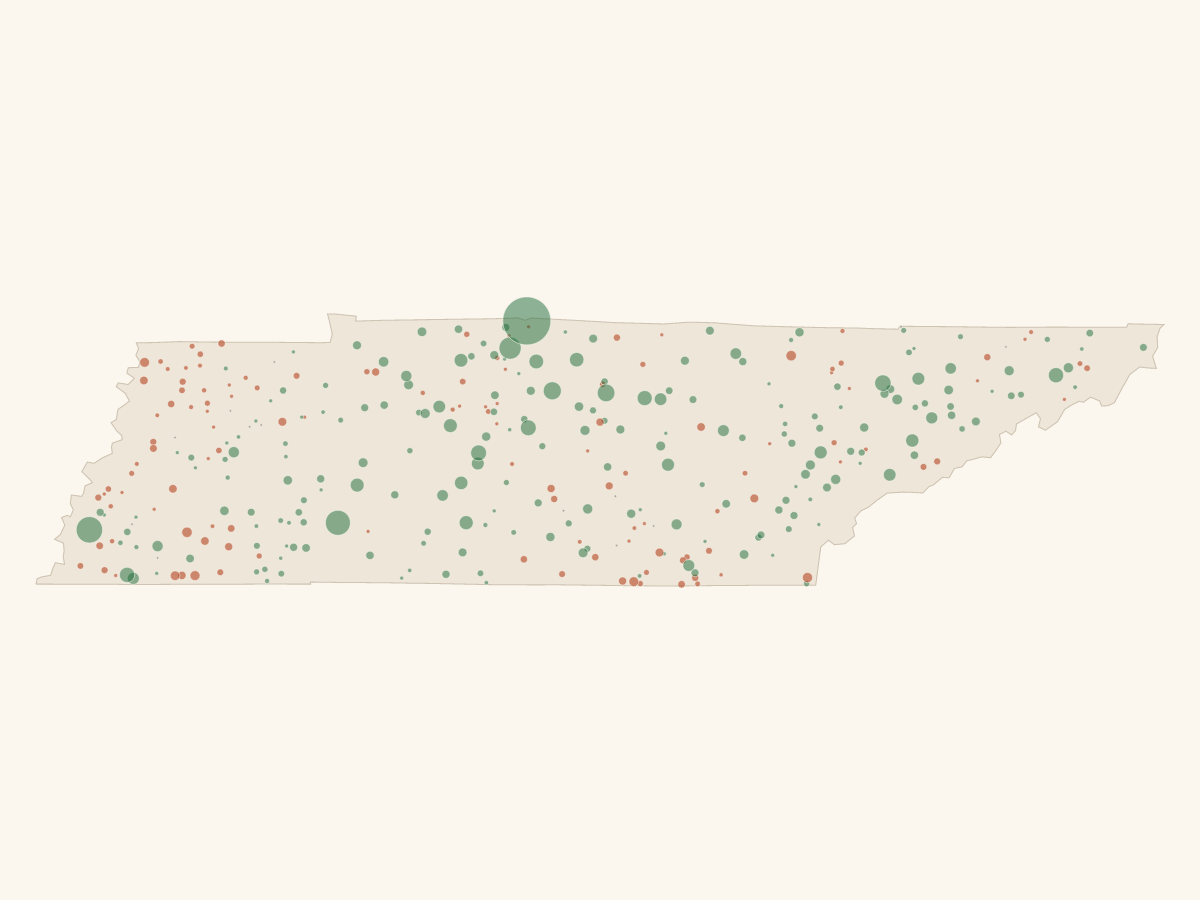
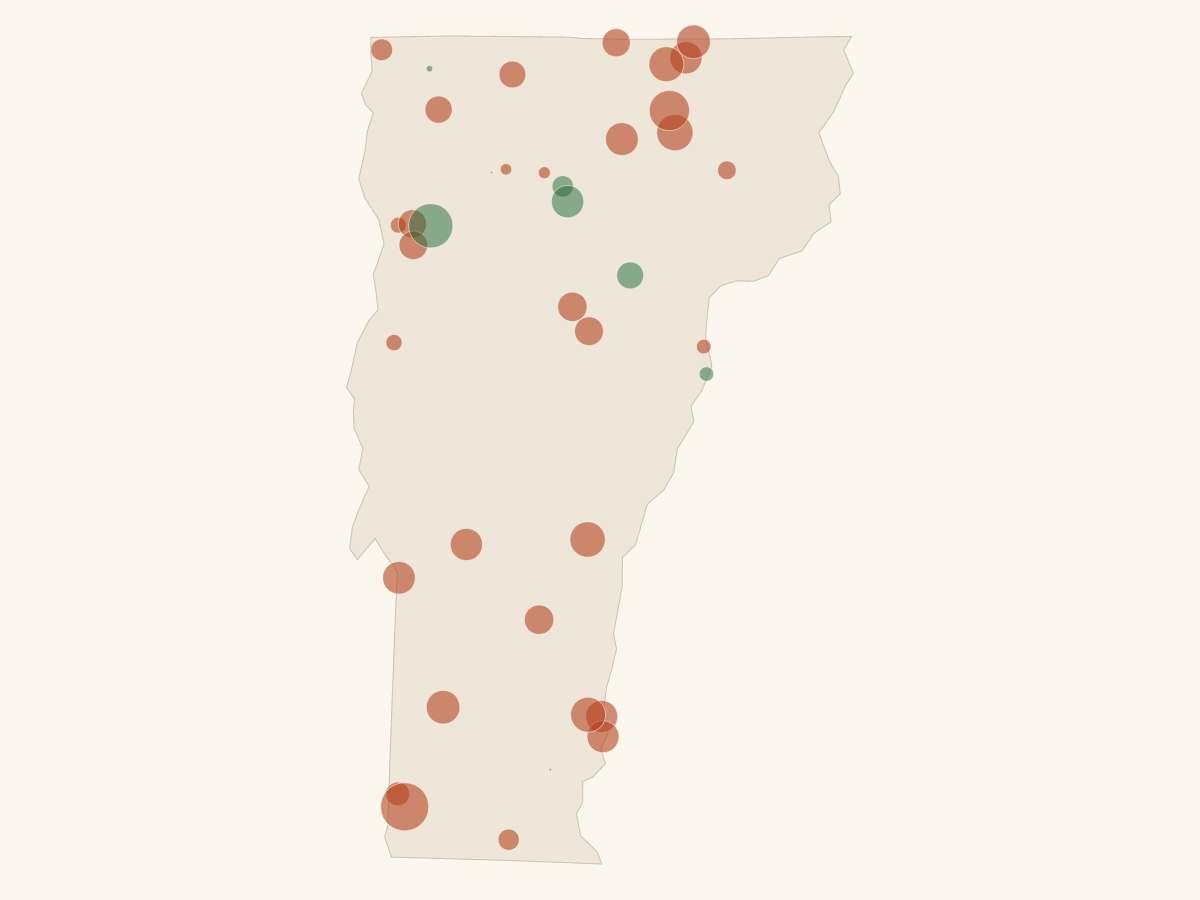
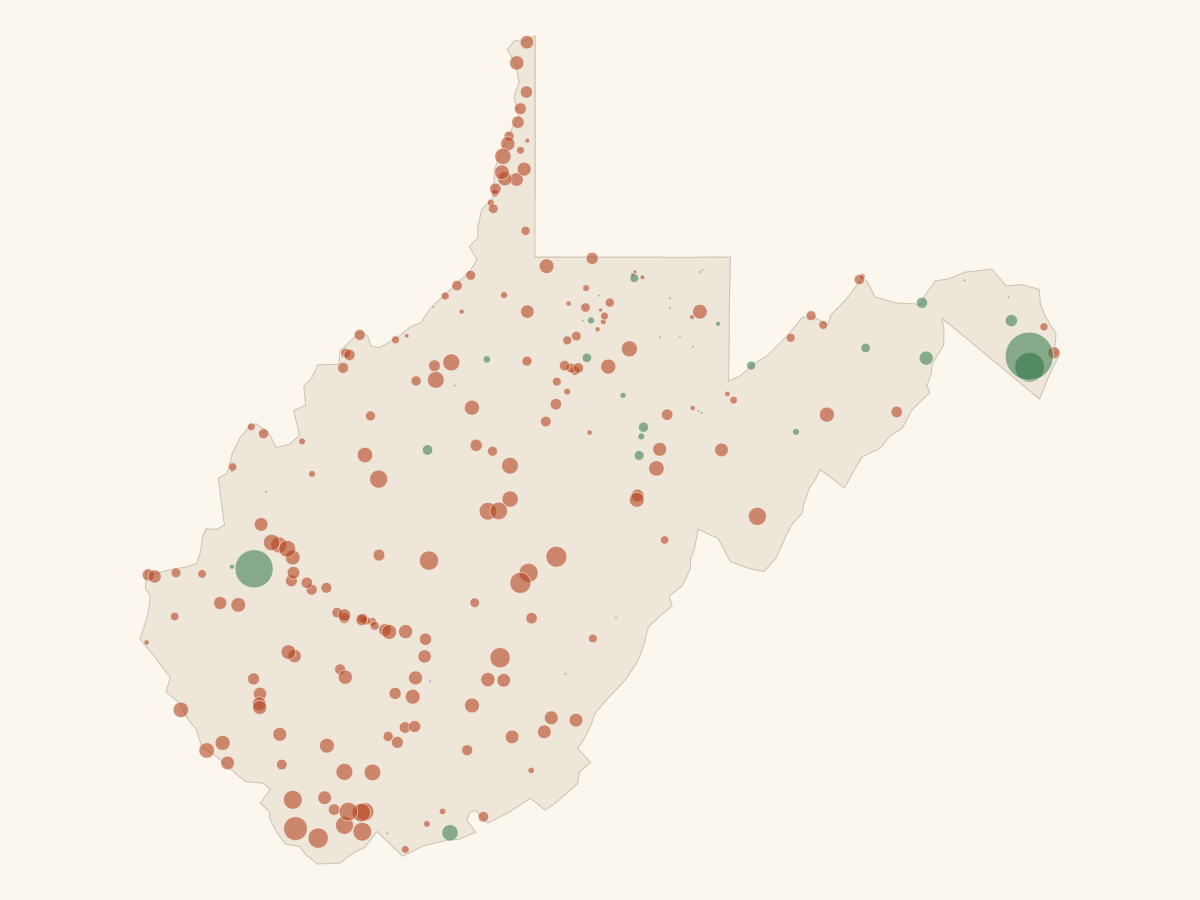
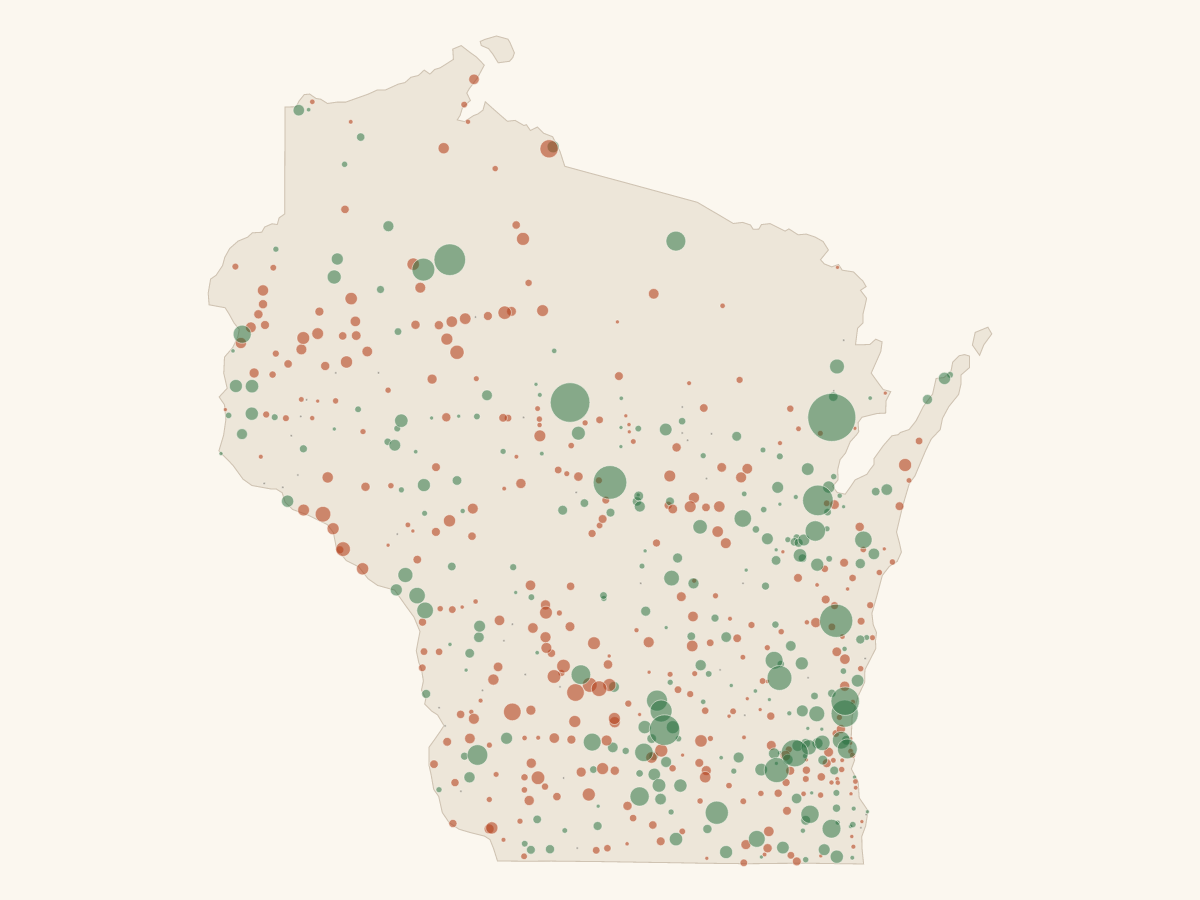
State map sets
50 states · 4 exports each
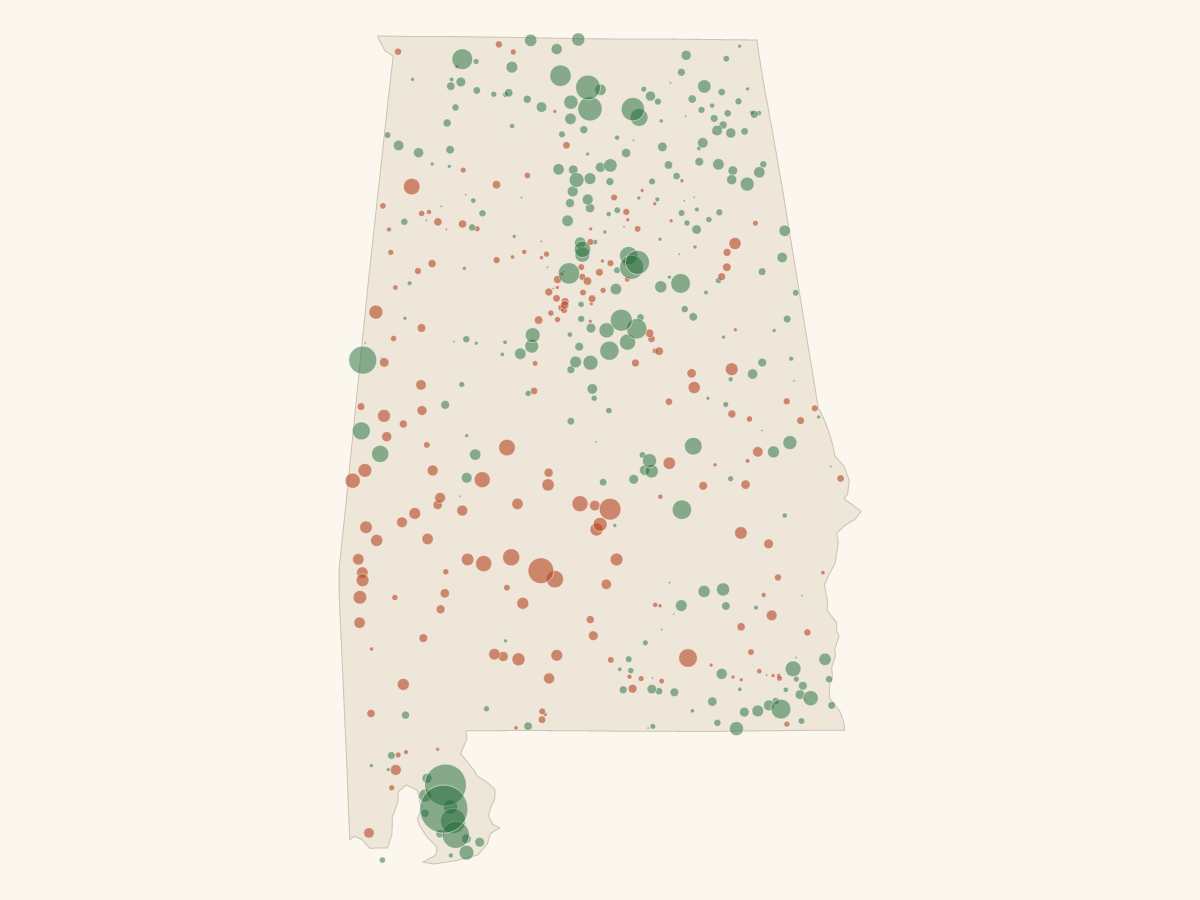
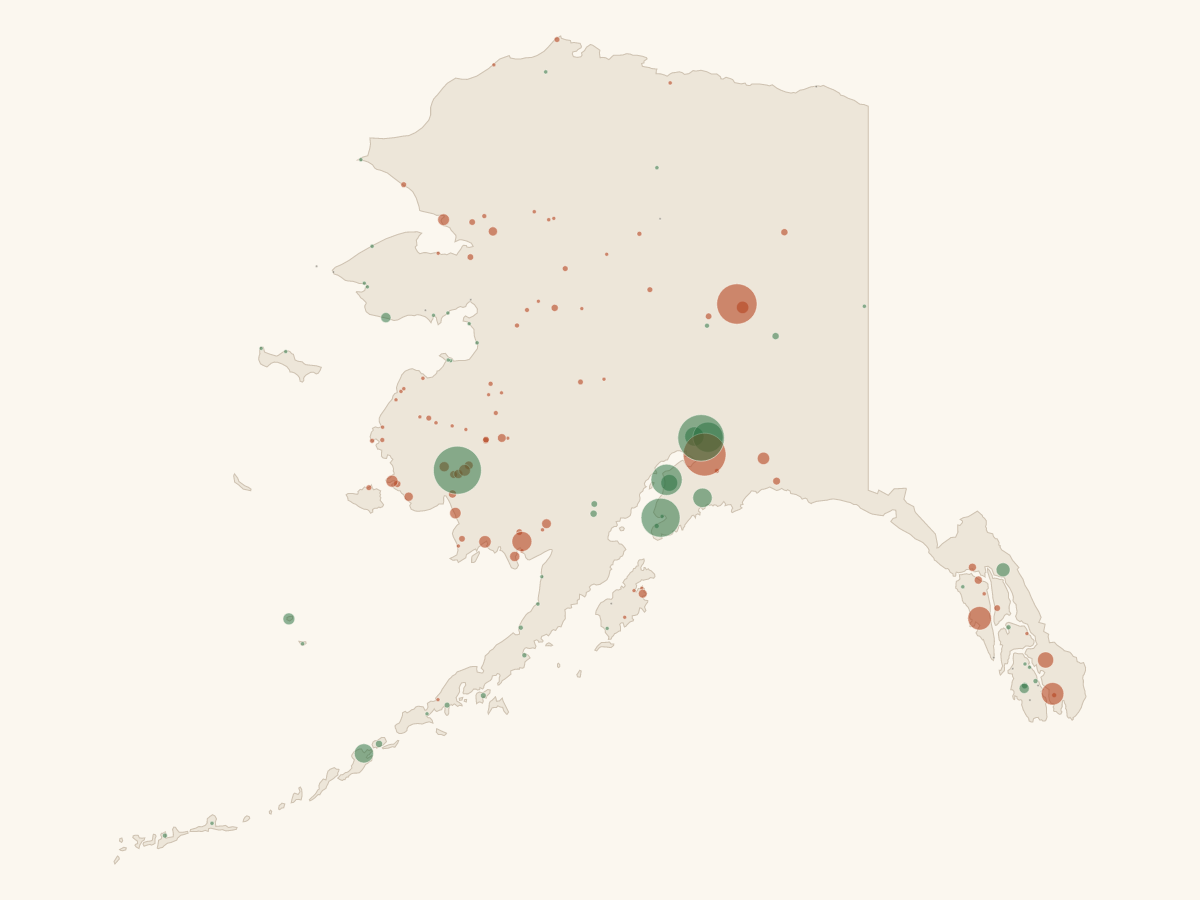
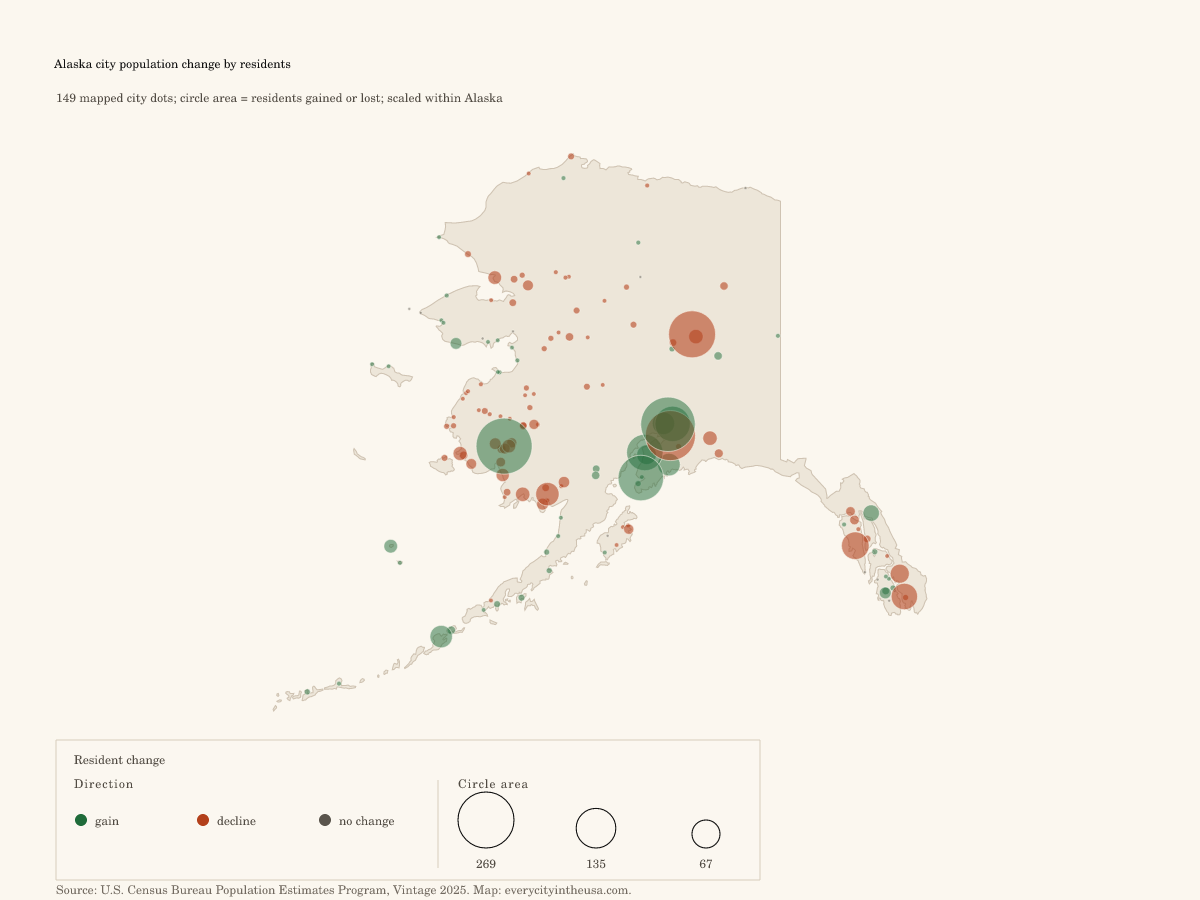
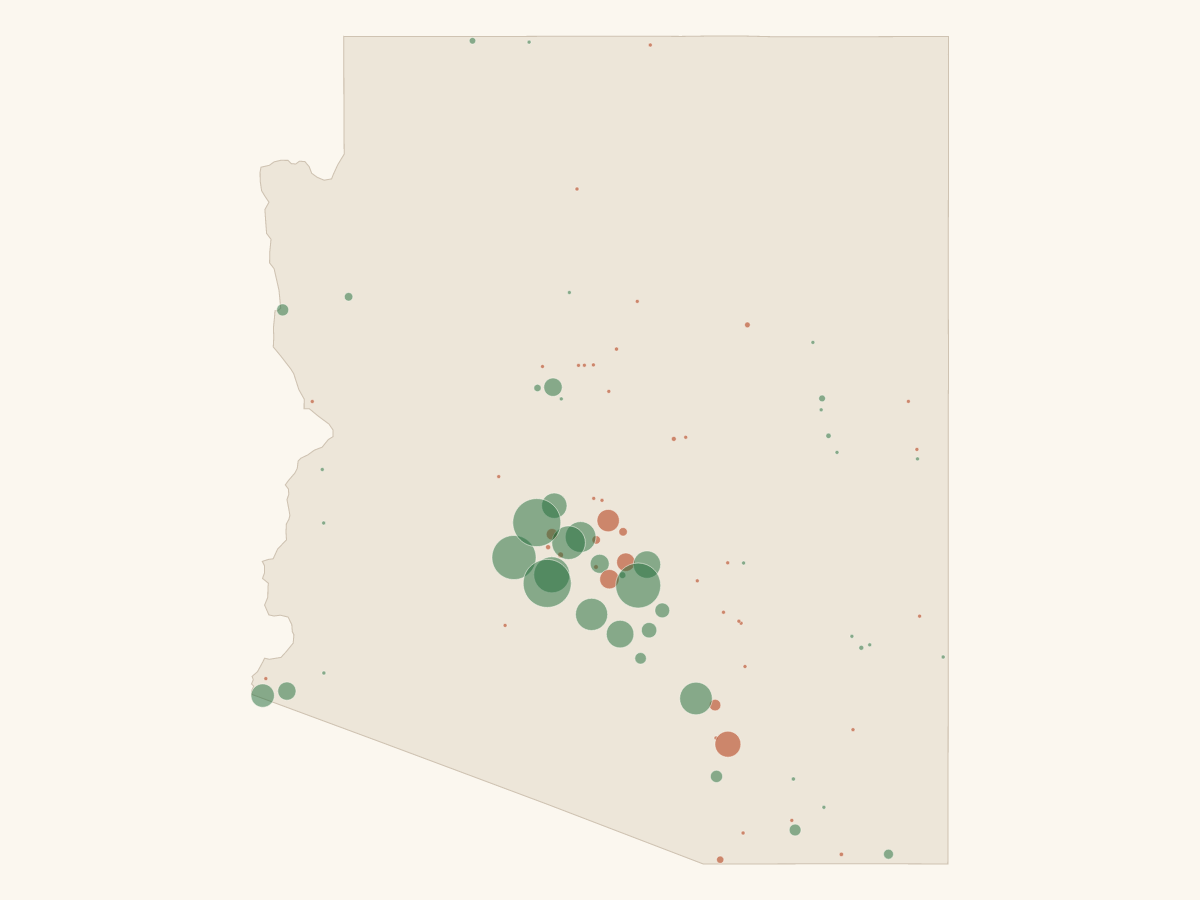
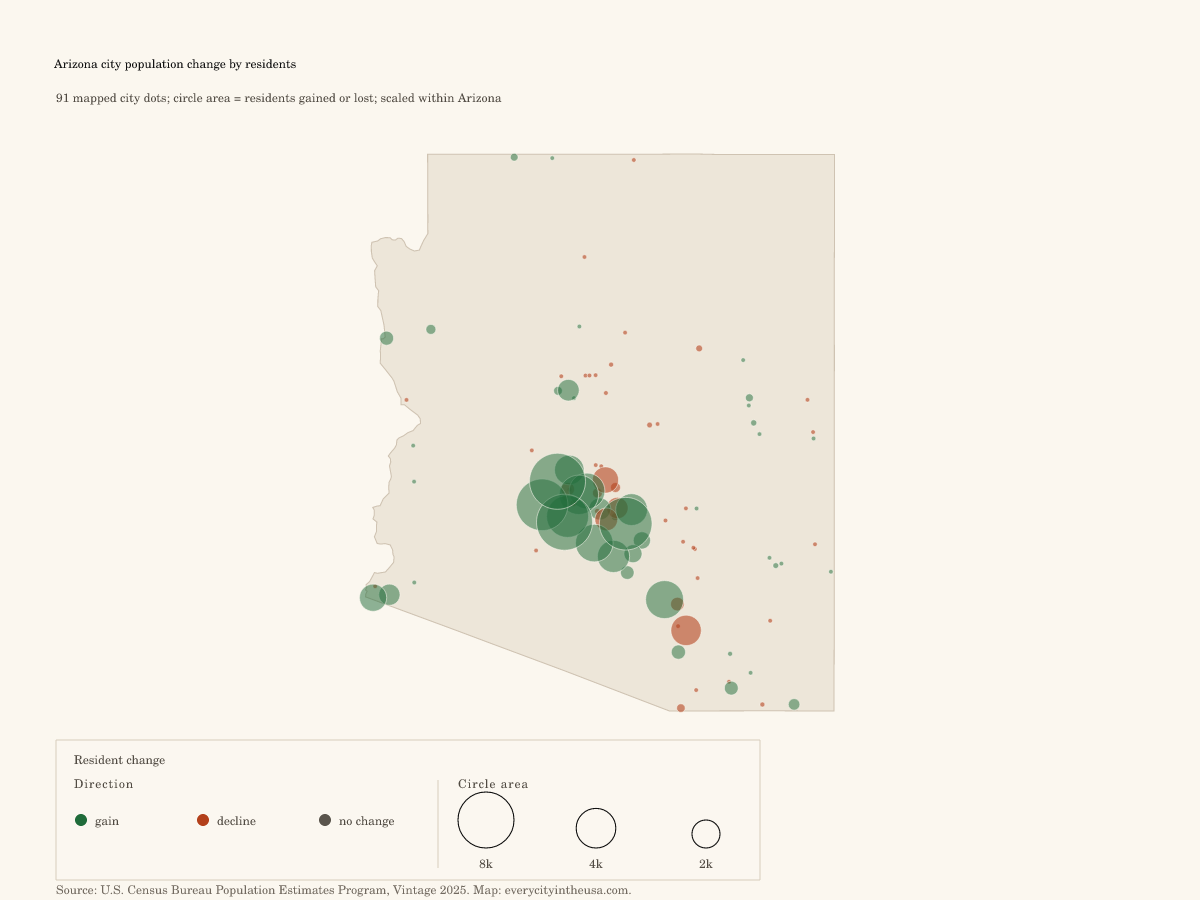
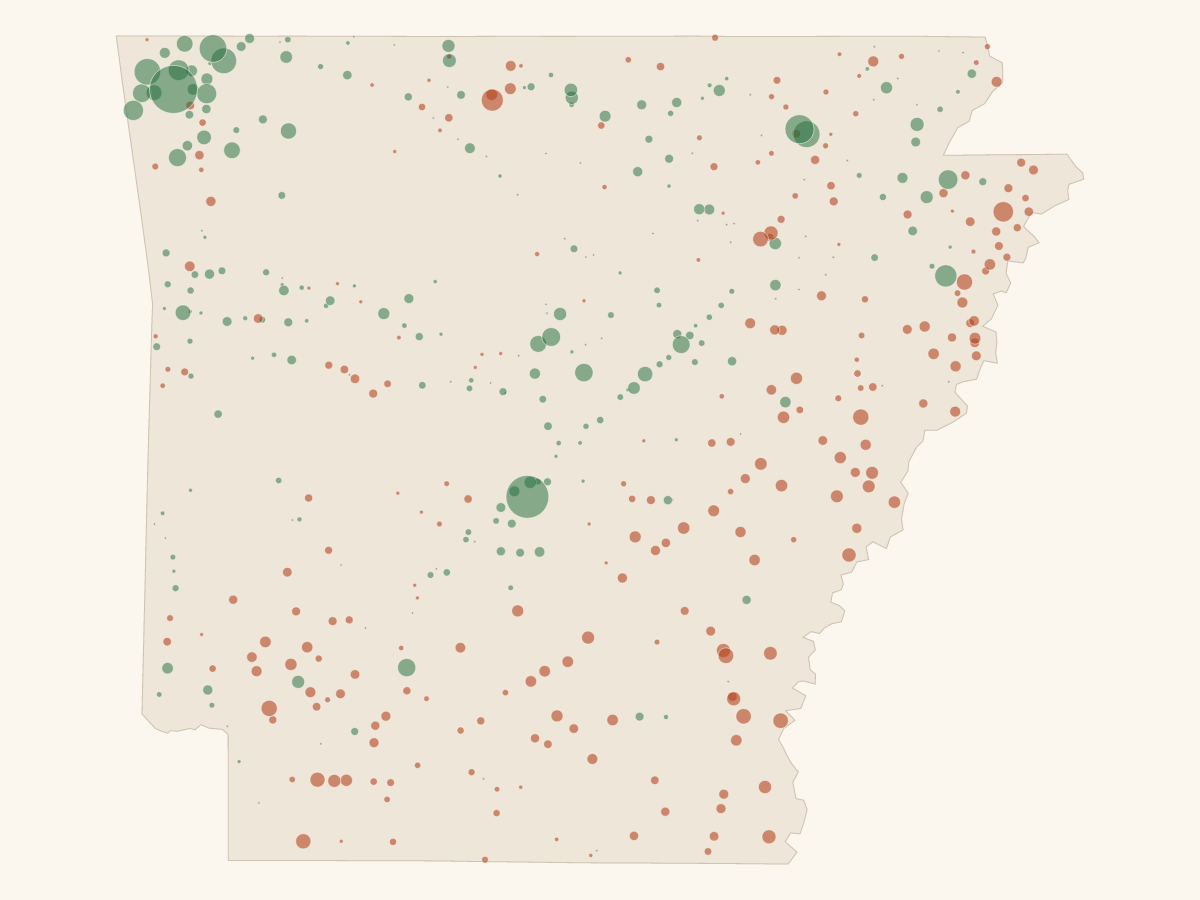
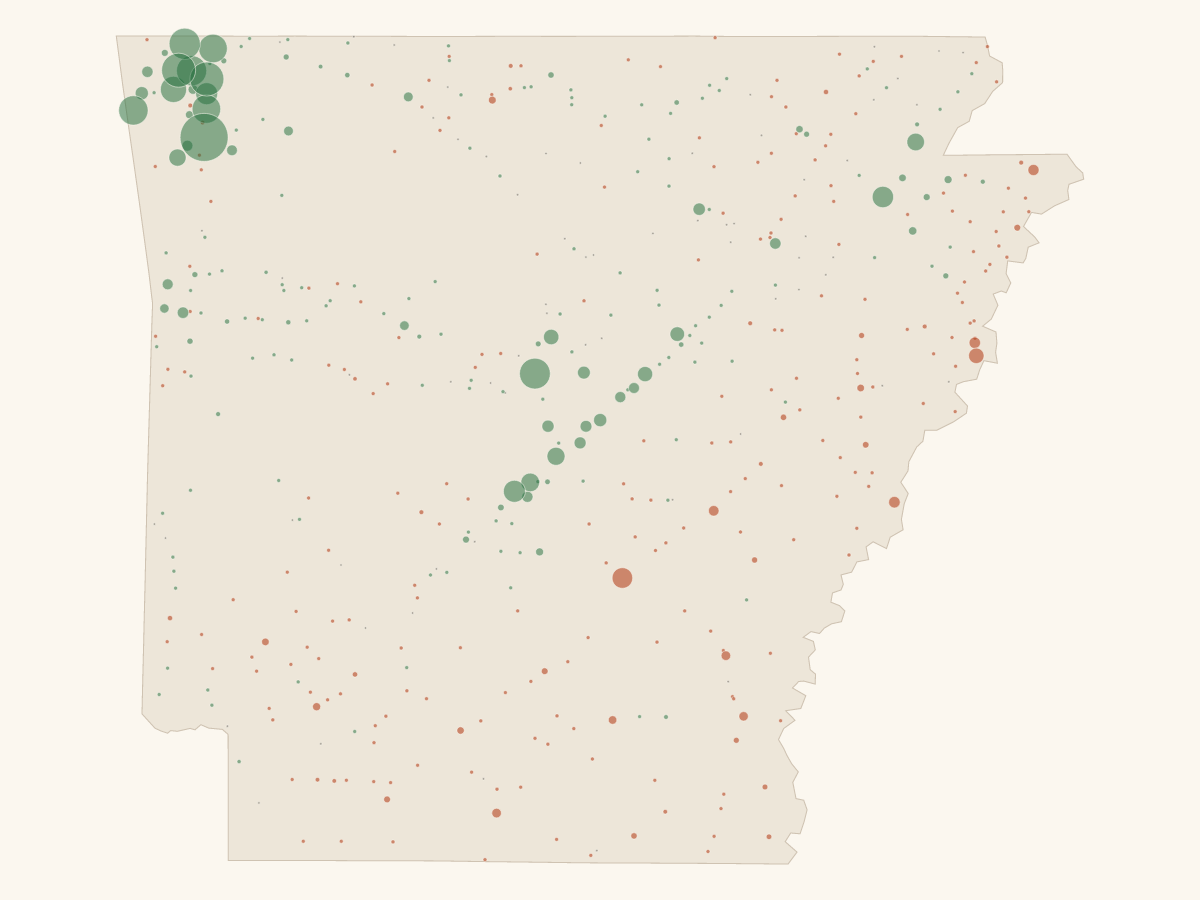
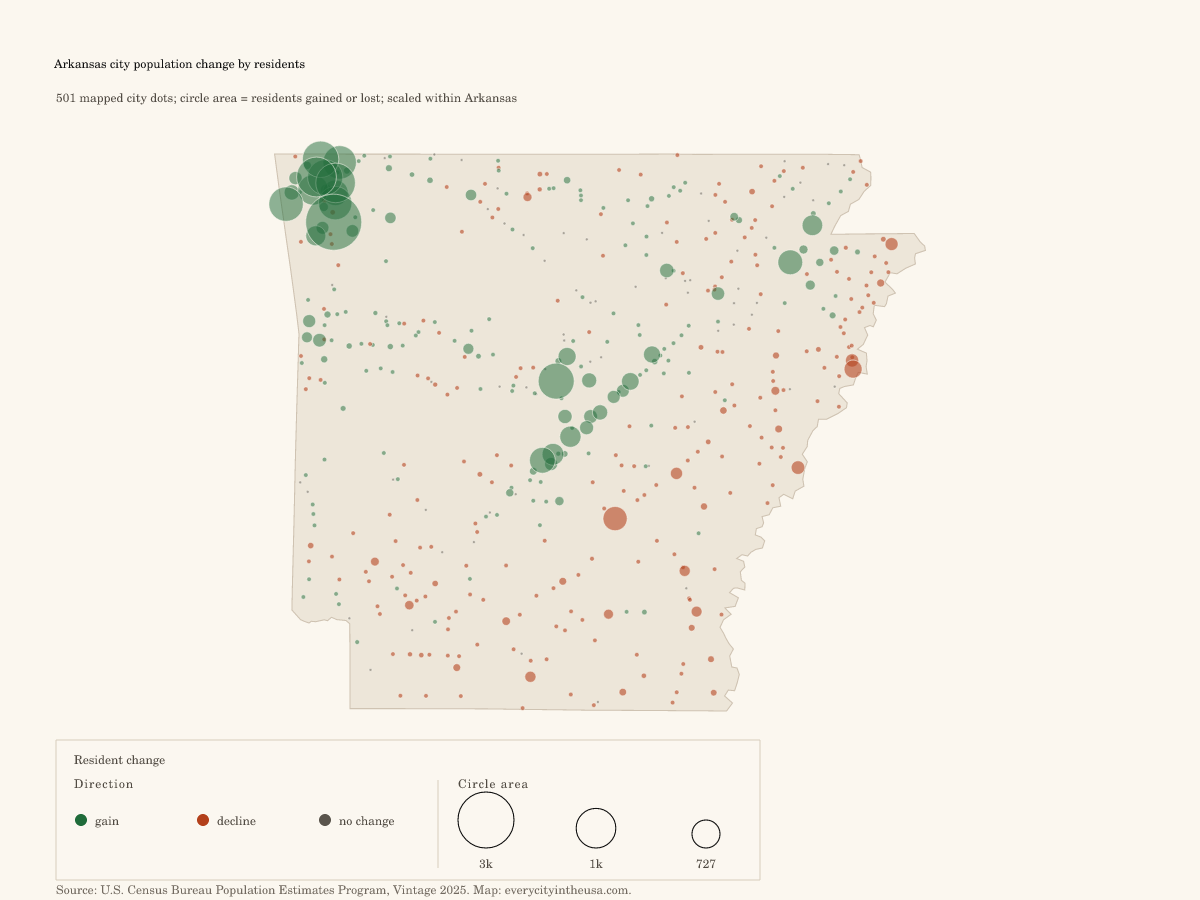
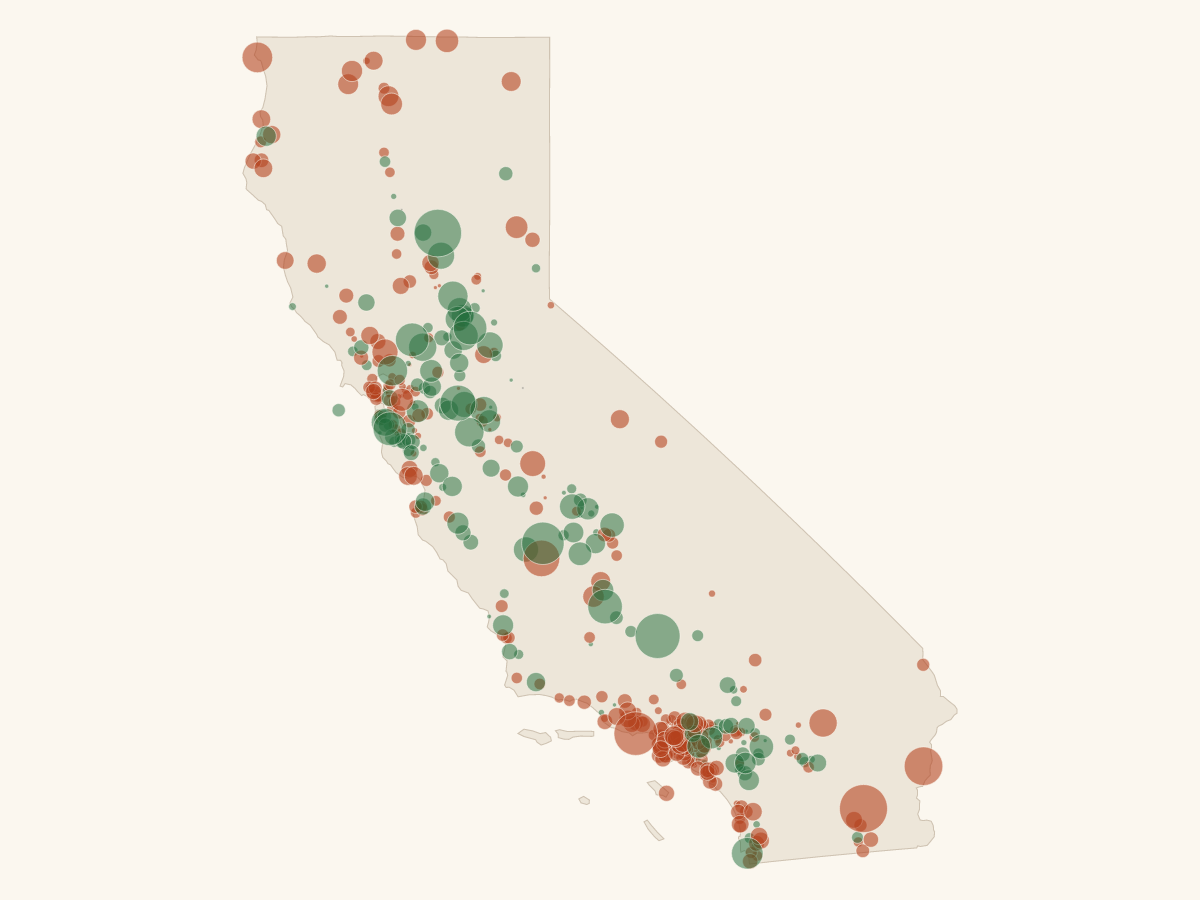
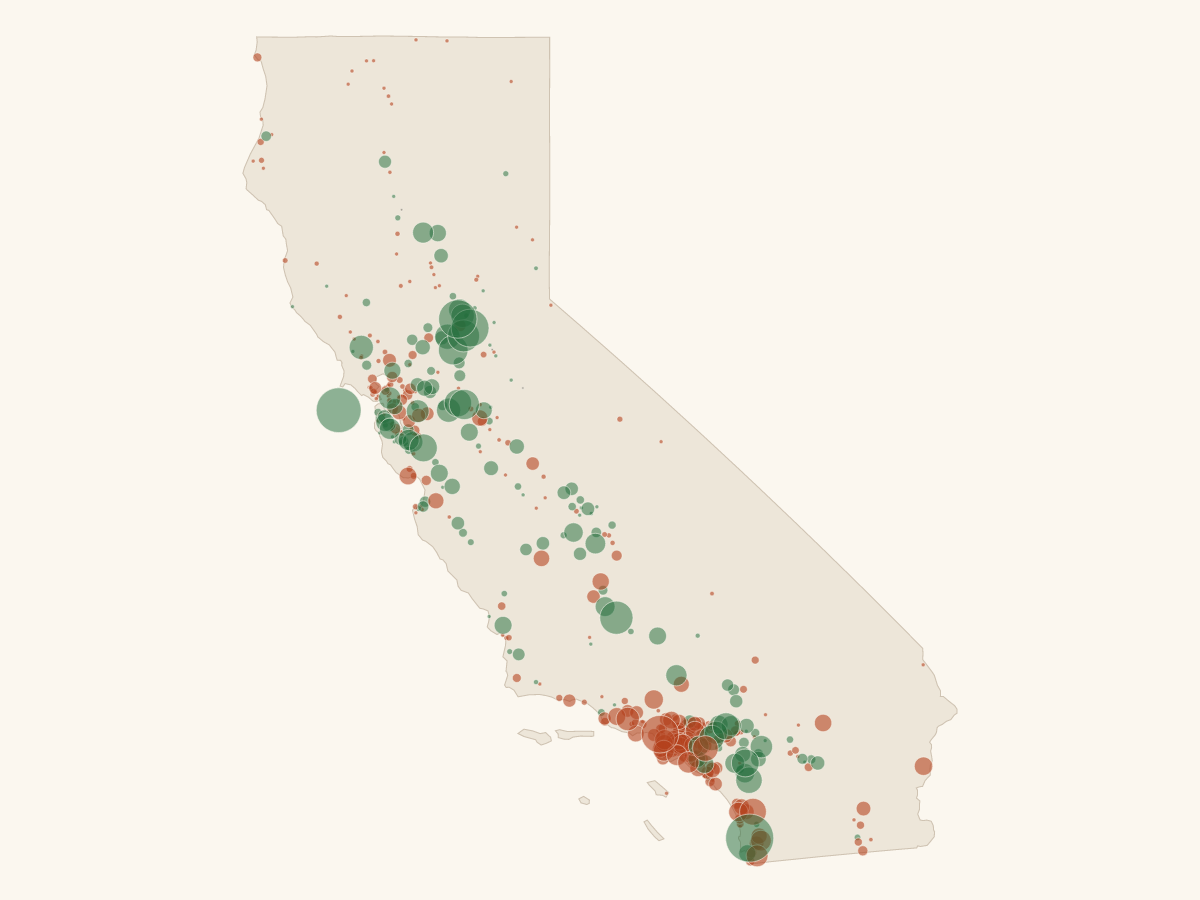
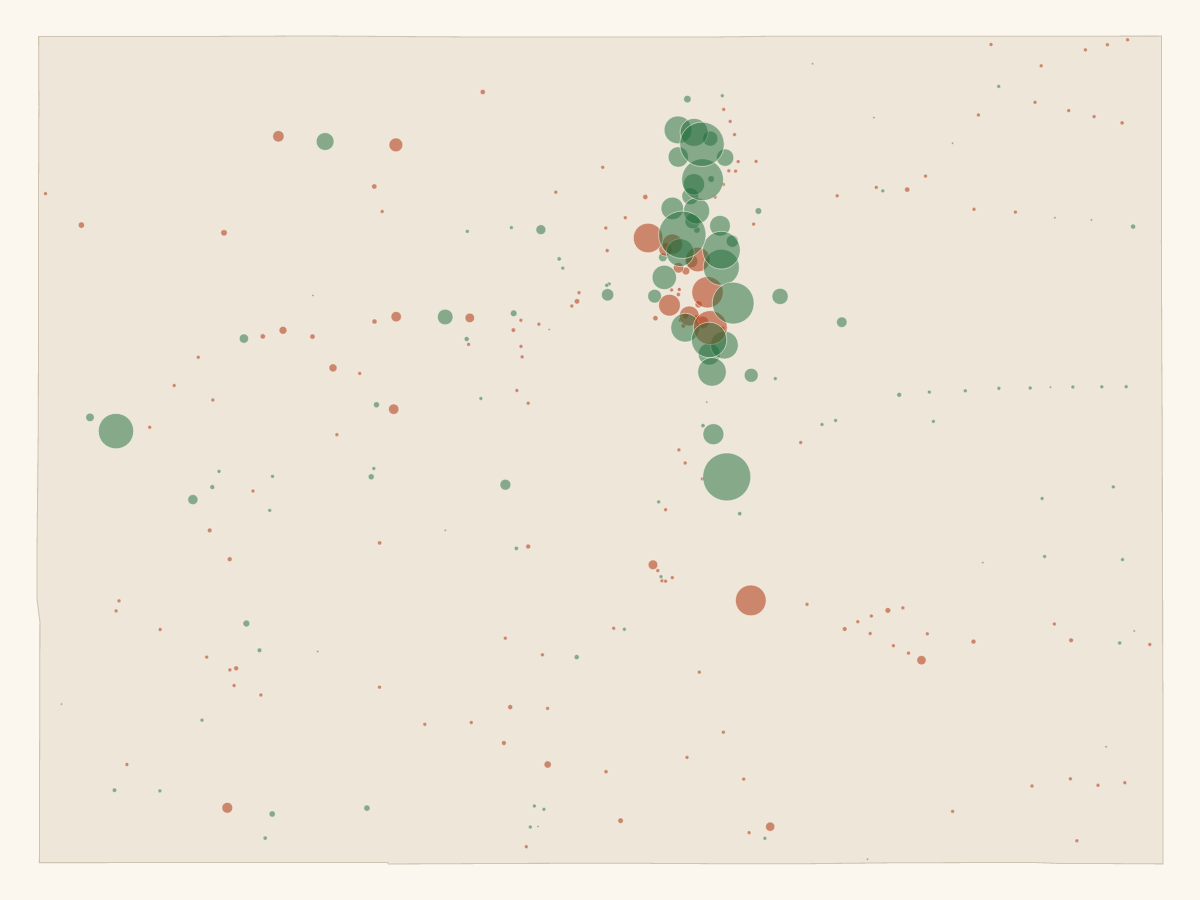
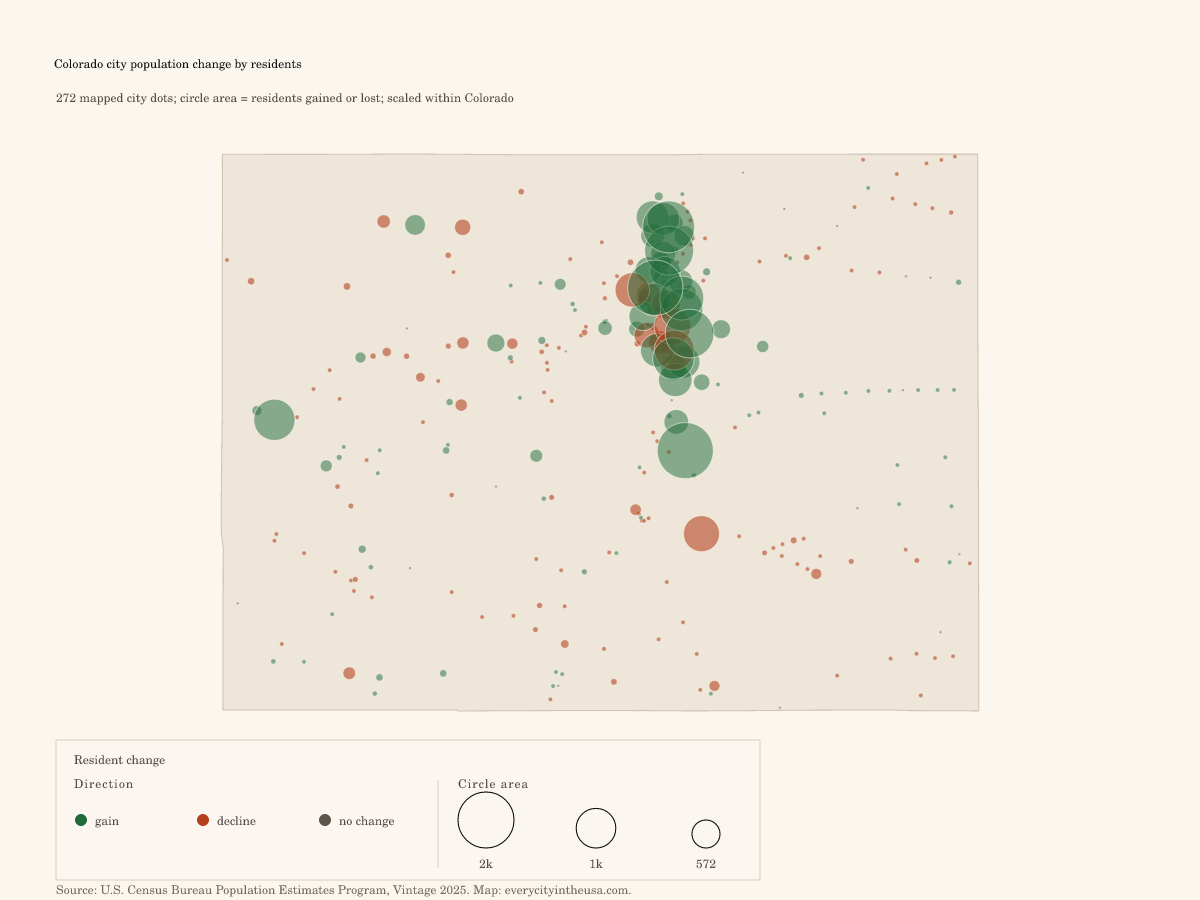
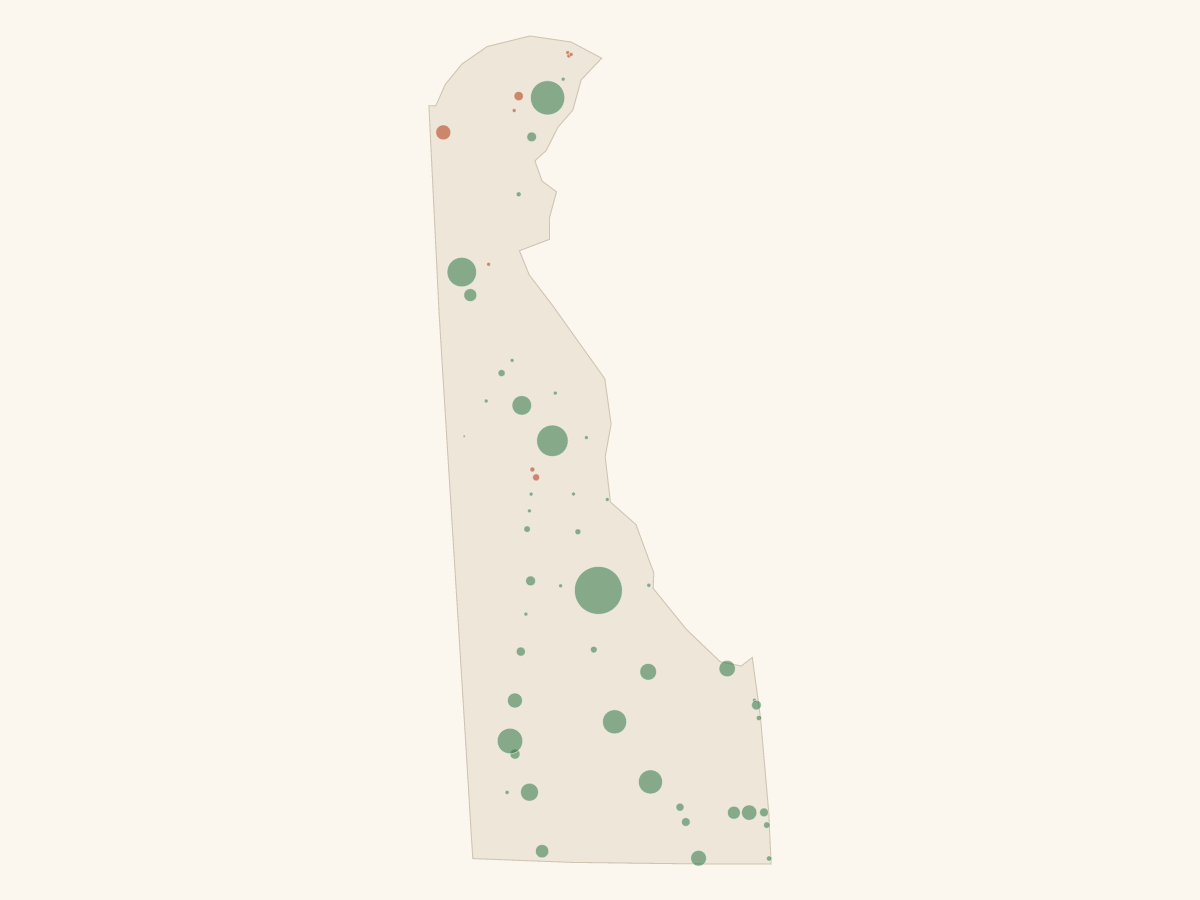
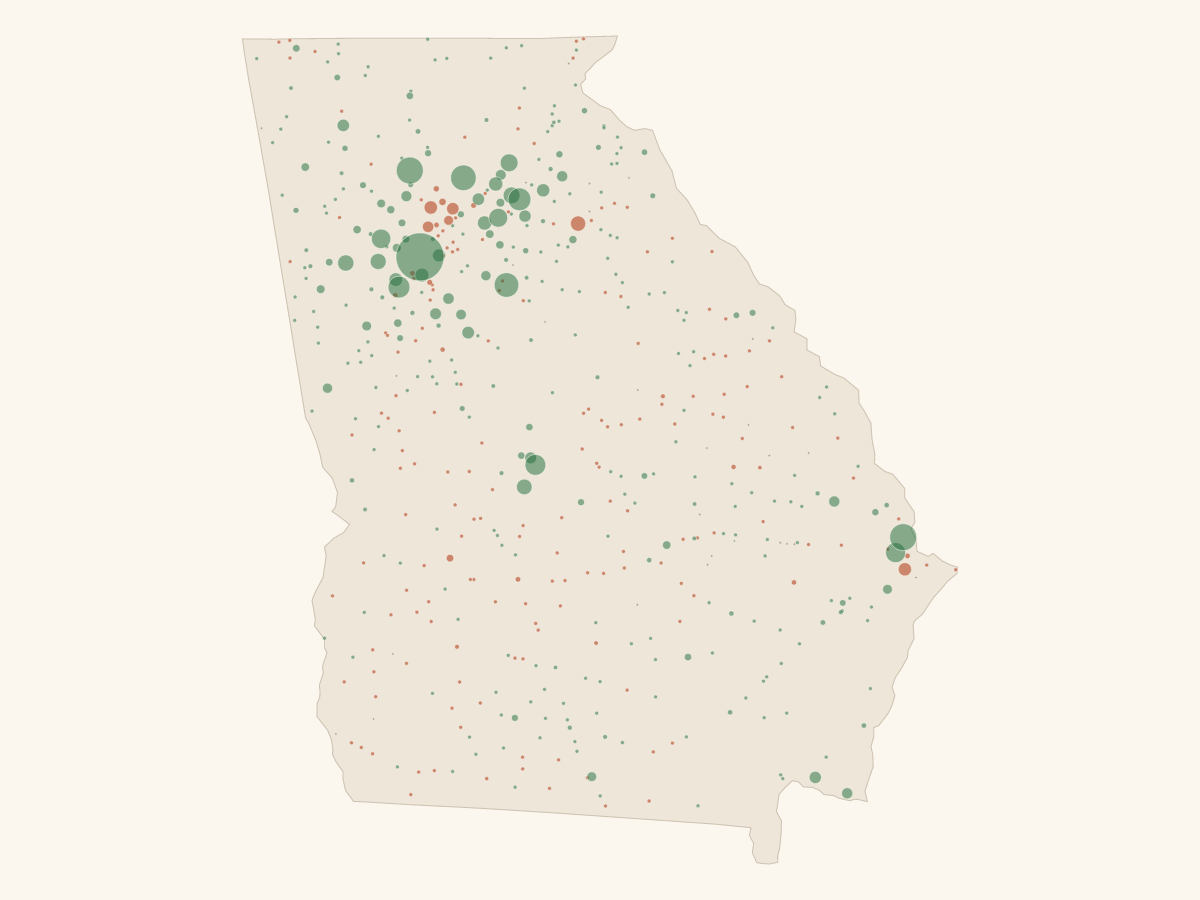
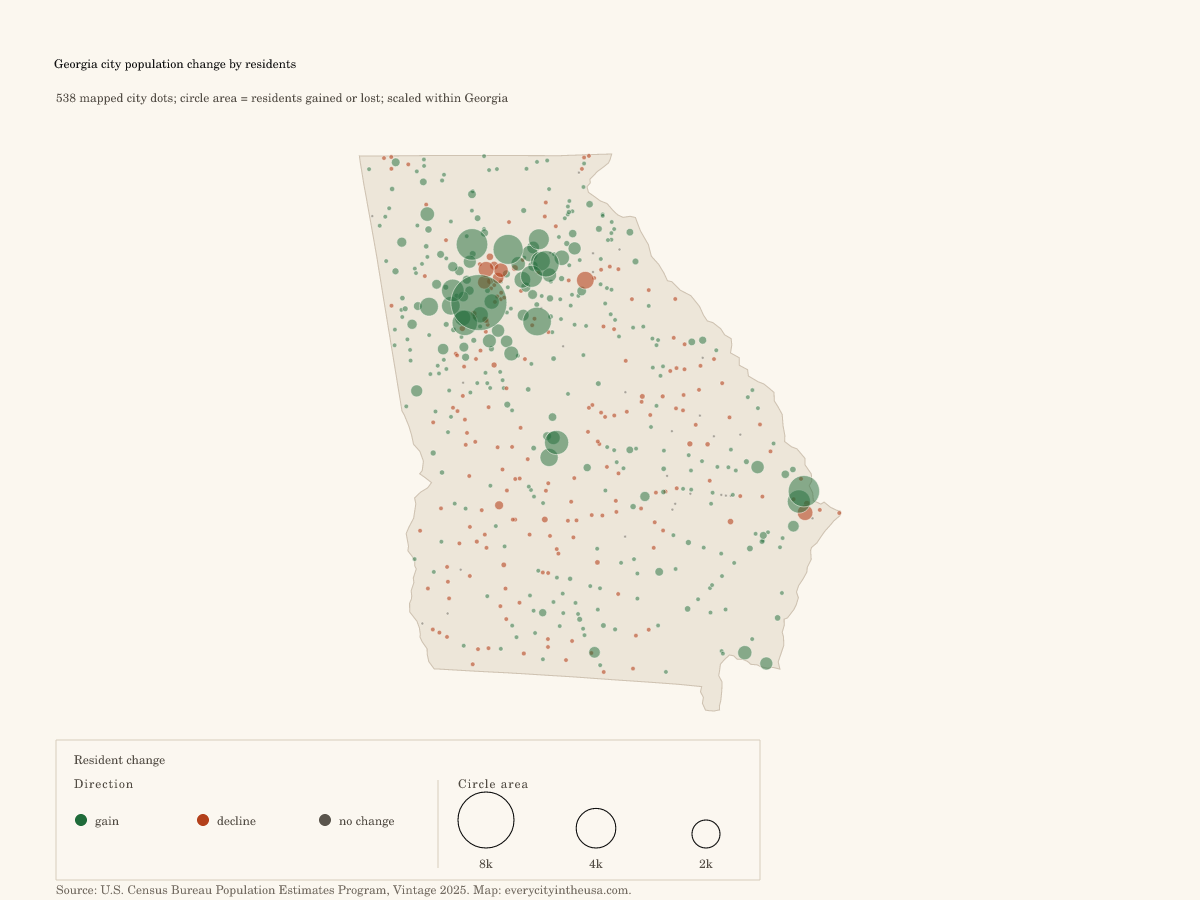
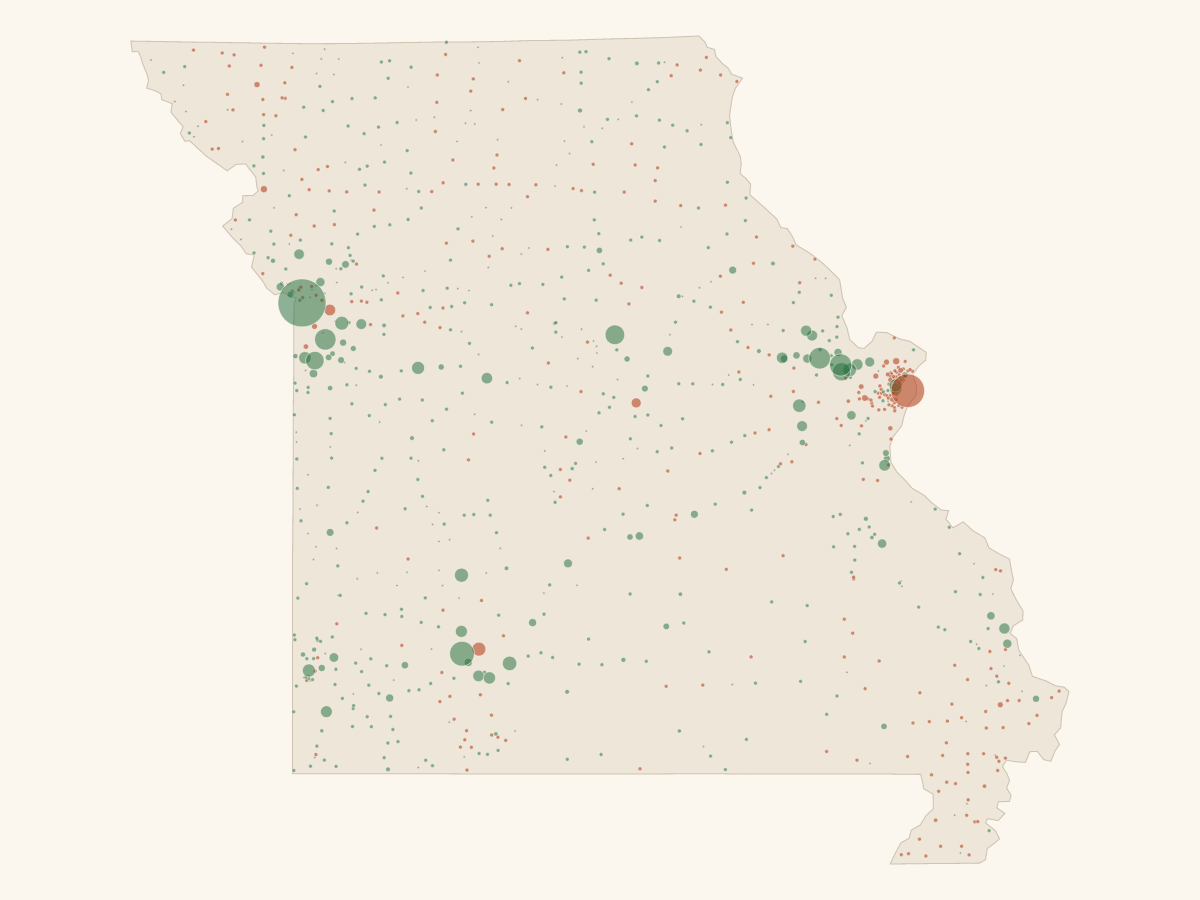
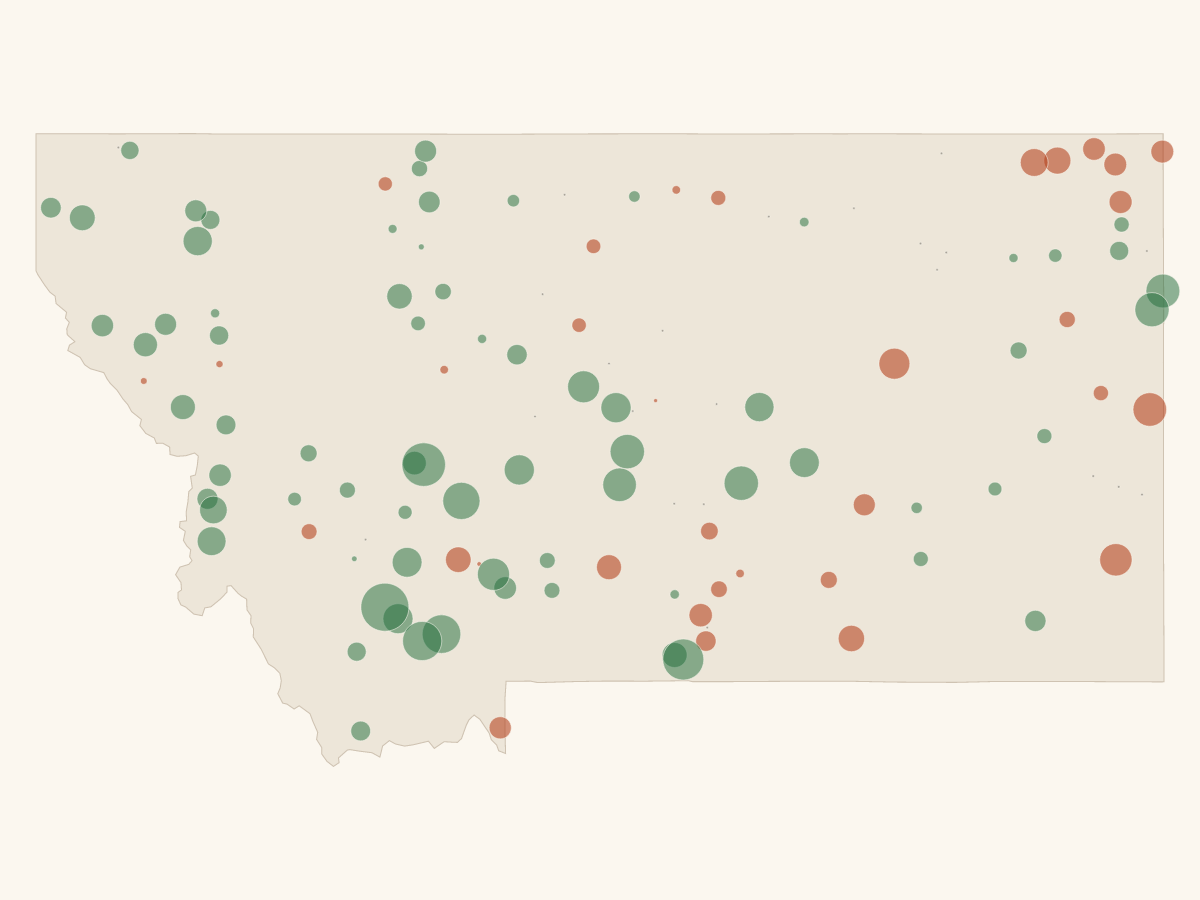
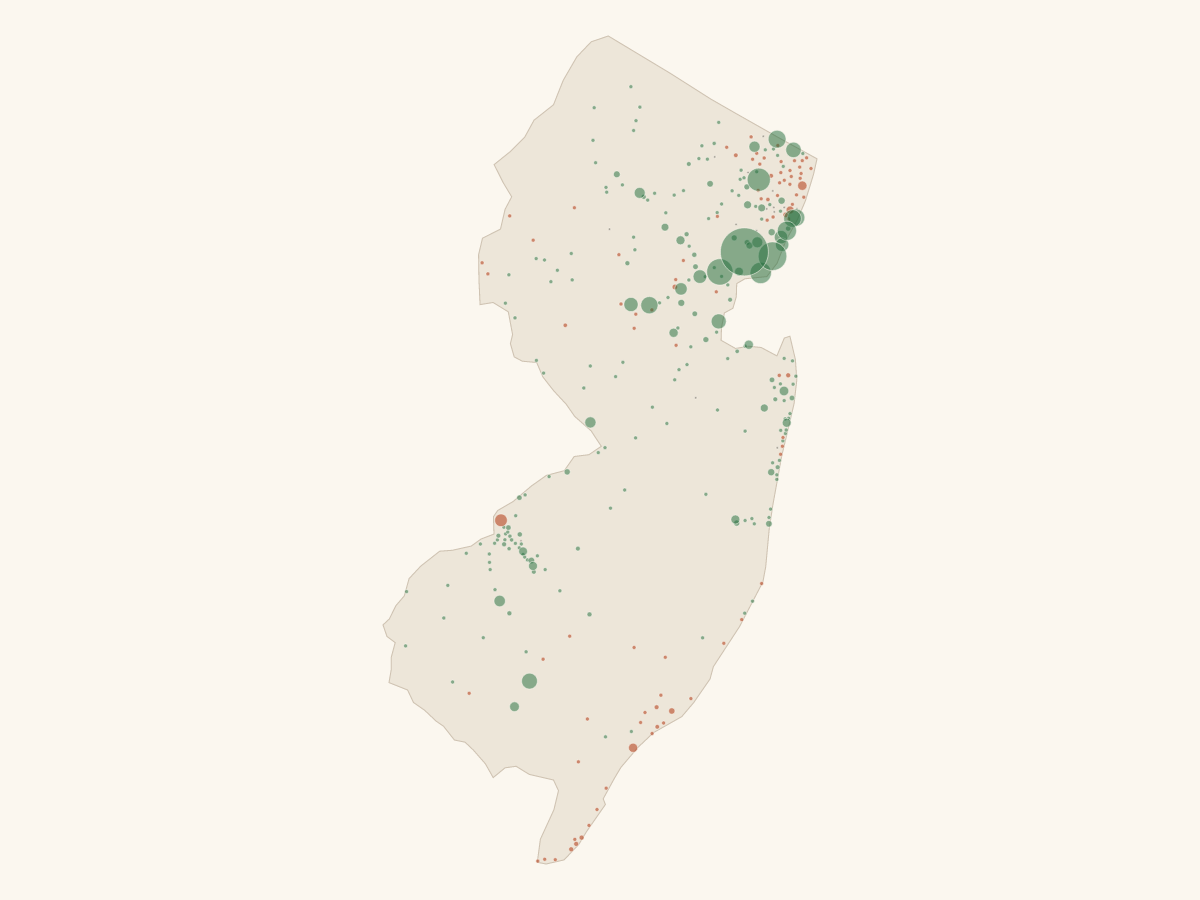
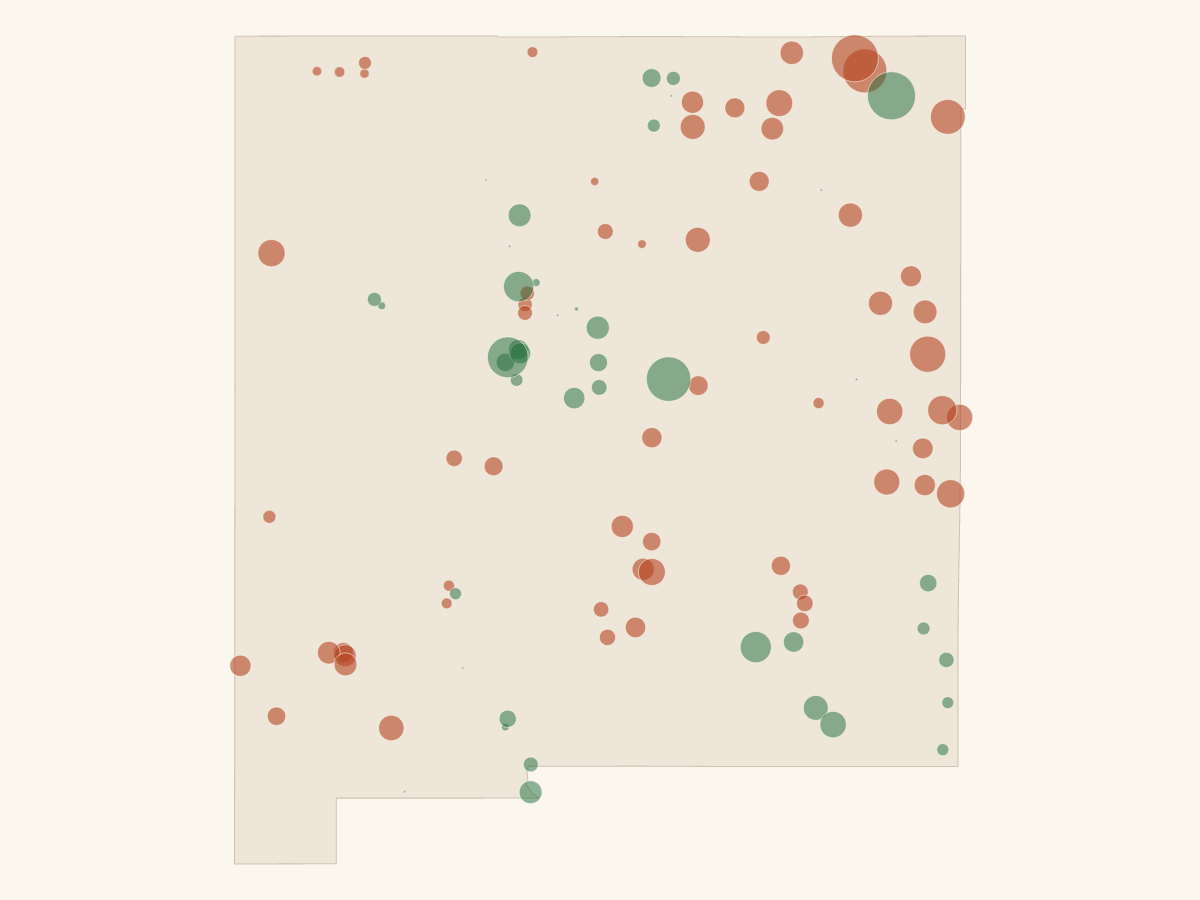
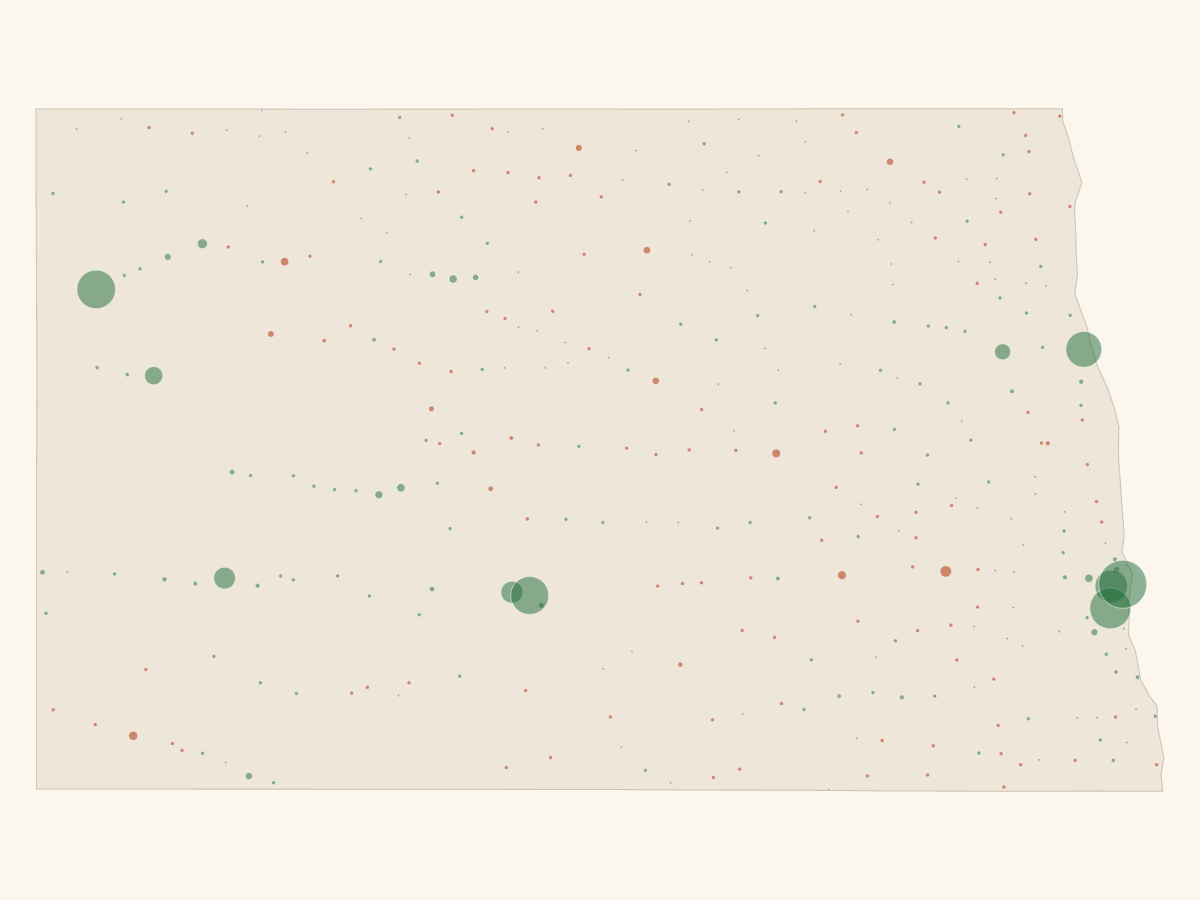
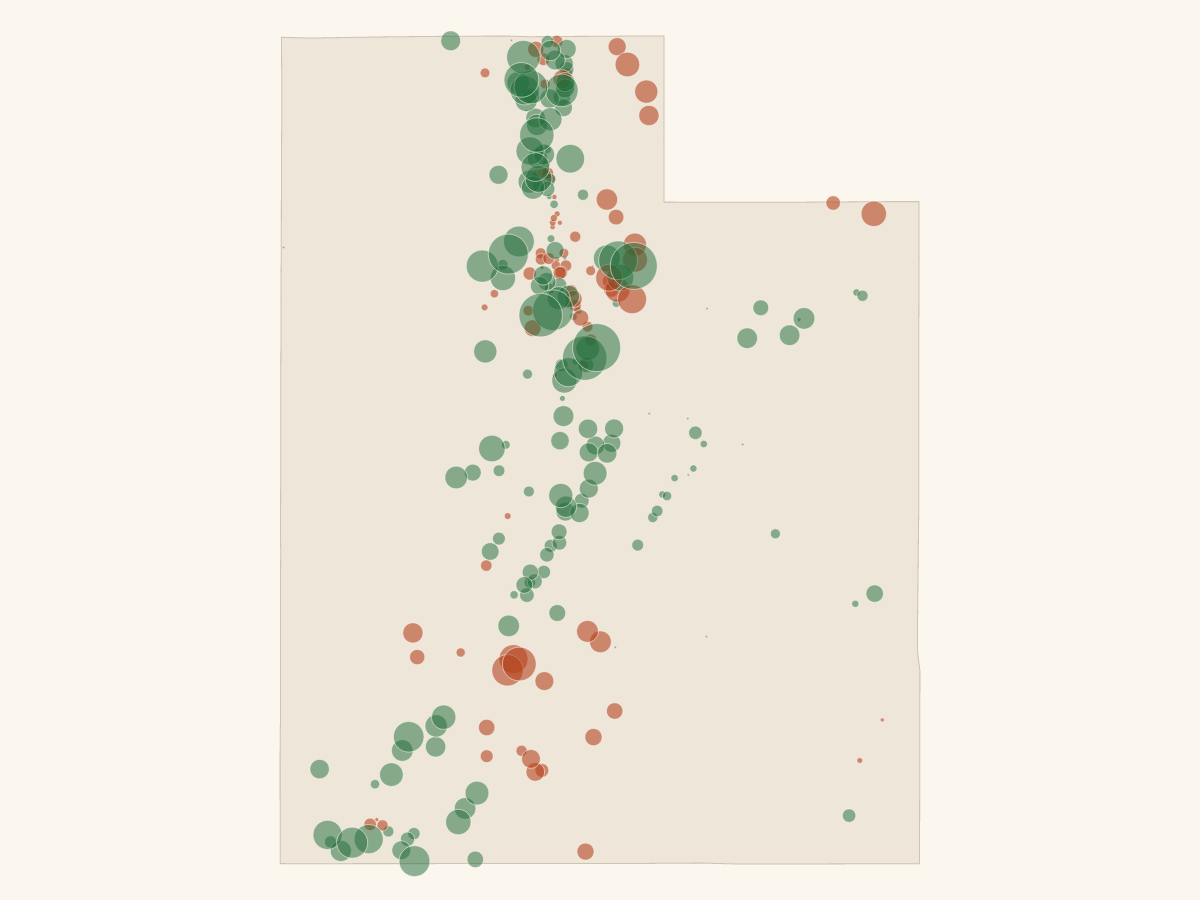
Pick a state to load its clean percentage-change lead map plus annotated percentage and resident-count alternatives. Circle areas are scaled within each state; use the national maps above for cross-state visual scale.
The fastest way in is local: pick a state, compare the biggest positive gainer with the fastest qualifying city, then check milestones and one-year declines before pitching a growth story.
A per-state summary built for assignment editors: fastest qualifying city, biggest positive numeric gainer, largest current city, largest one-year decline where present, and a state-specific CSV for local sorting.
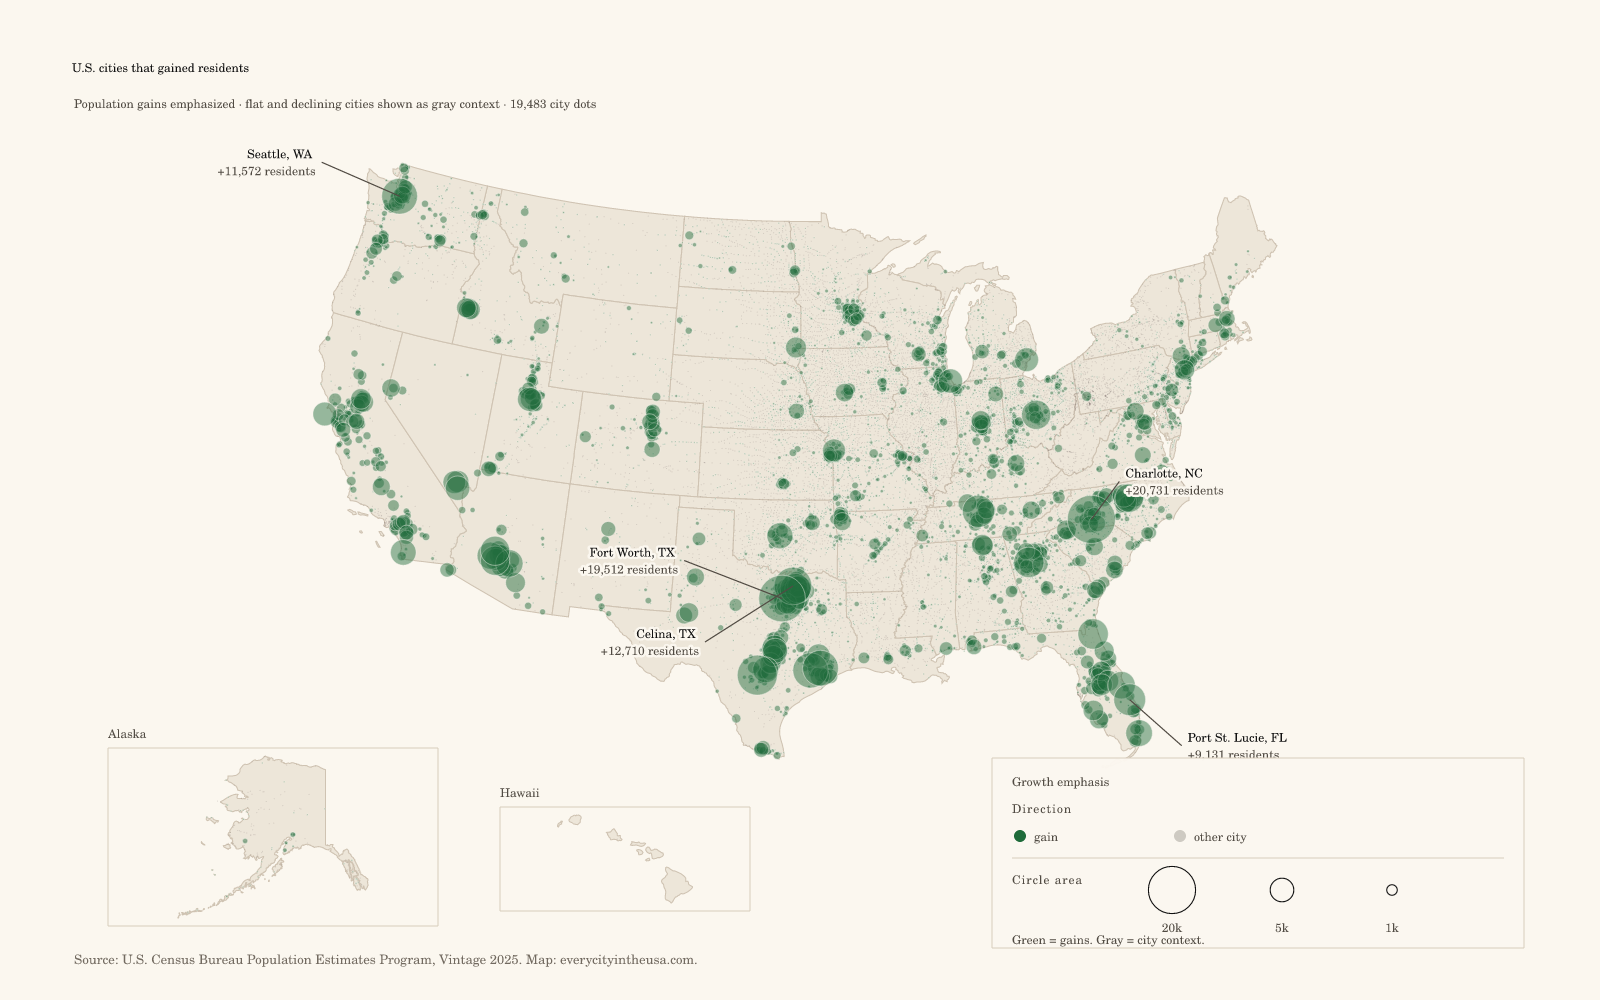
Charlotte, NC added +20,731 residents, the largest one-year numeric gain in this slice. Numeric gain reflects total population change, not net migration.
Milestone crossings
6 threshold crossings
Cities that crossed a round-number population threshold between the 2024 and 2025 estimates.
These are assignment-ready angles, not causal claims. Each lead pairs the new city growth estimates with one official context dataset and carries its caveat beside the chart idea.
01
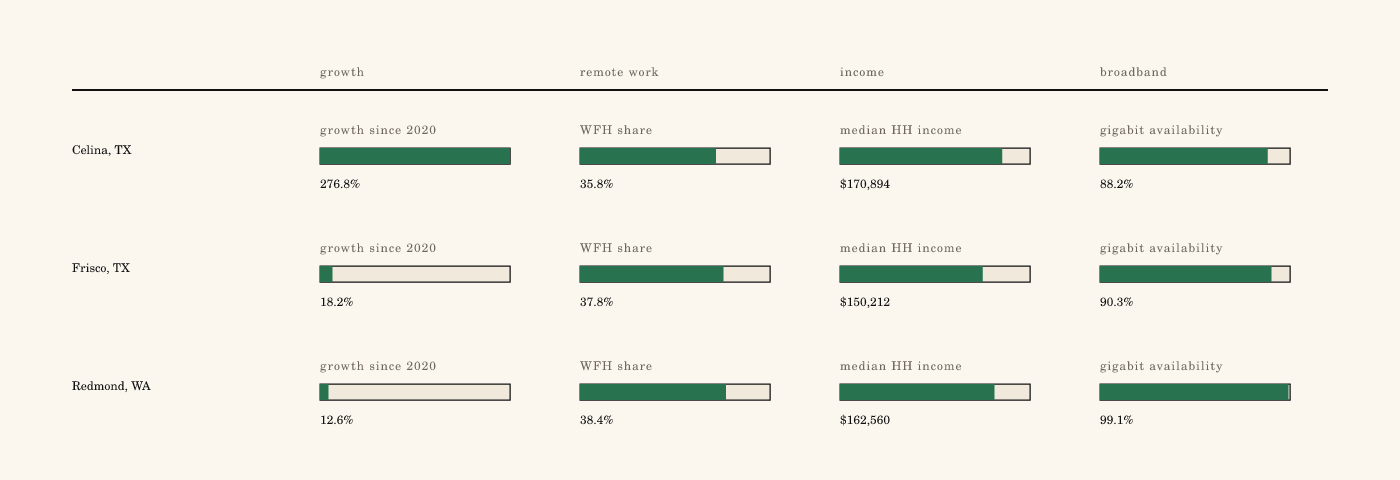
Opportunity + broadband
Growth cities with WFH and broadband context
Three high-income growth cities where work-from-home shares clear 35% and provider-reported gigabit availability is high. This is context for reporting, not a causal explanation for growth.
Celina, TX: +276.8% since 2020, +24.6% in one year, 35.8% WFH, $170,894 median household income, 88.2% gigabit availability.
Frisco, TX has 37.8% WFH and 90.3% gigabit; Redmond, WA has 38.4% WFH and 99.1% gigabit.
Site-derived lead. Sources: Census V2025, ACS 2020-2024, FCC BDC 2025-06-30. FCC is provider-reported availability, not adoption, speed, or price; this does not prove remote work caused growth.
Opportunity stack strips: growth, WFH share, income, and gigabit availability.SVGPNG
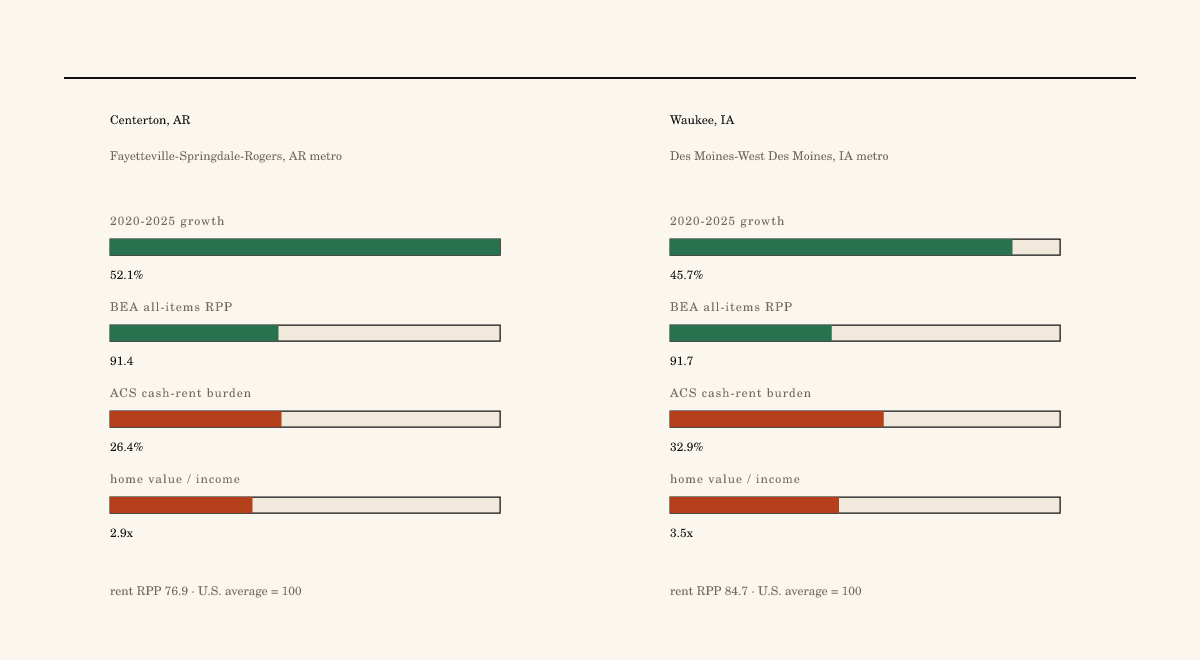
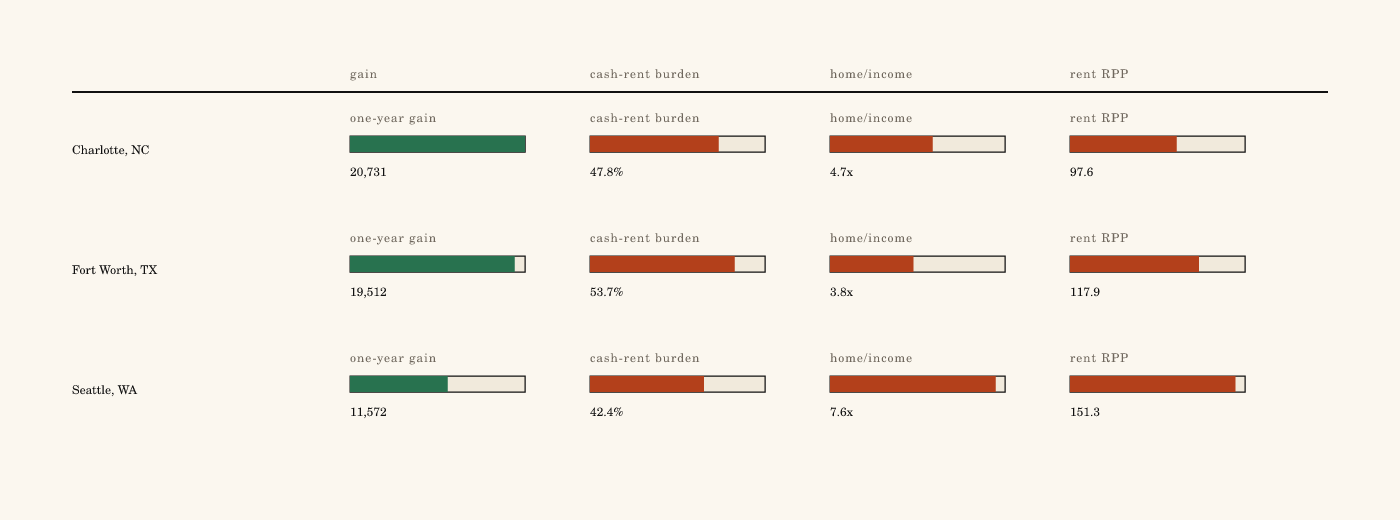
Large numeric gainers do not share the same affordability reality once rent burden, home-value-to-income ratios, and regional rent prices are layered in.
Charlotte added +20,731 residents with 47.8% cash-rent burden, home-value-to-income 4.7, and rent RPP 97.6.
Fort Worth added +19,512 with 53.7% cash-rent burden and rent RPP 117.9; Seattle added +11,572 with 42.4% cash-rent burden, rent RPP 151.3, and home-value-to-income 7.6.
Site-derived lead. Sources: Census V2025, ACS 2020-2024, BEA RPP. BEA RPP is regional, not city-grain; population growth alone does not measure housing shortage.
Ranked housing-stress bars beside one-year population gain.SVGPNG
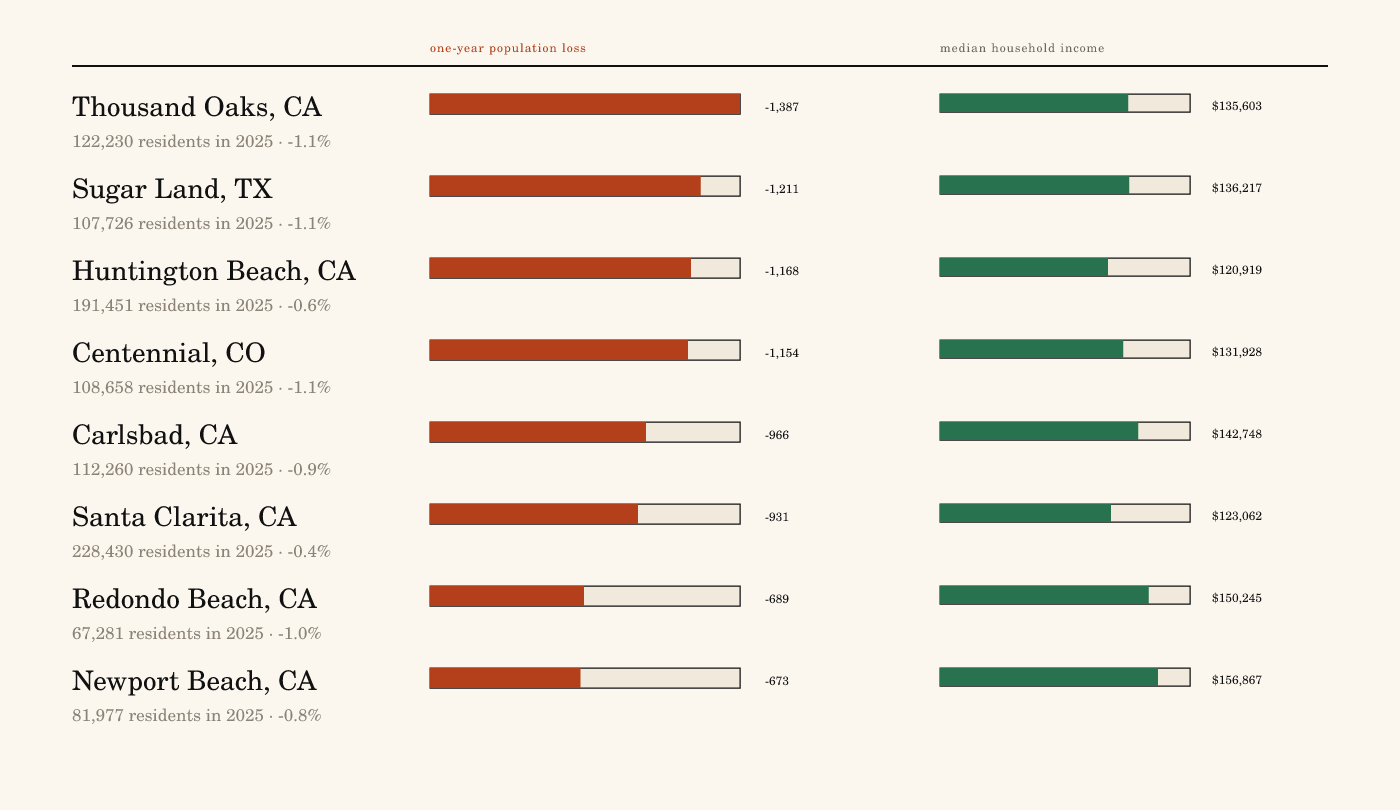
A clean localizable counter-story: affluent suburbs can still post one-year population declines. Local reporting should test whether housing age, prices, household size, or estimate noise is part of the explanation.
Thousand Oaks, CA lost 1,387 residents from 2024 to 2025 with ACS median household income of $135,603.
Sugar Land, TX lost 1,211; Huntington Beach, CA lost 1,168; Centennial, CO lost 1,154.
Carlsbad, Santa Clarita, Redondo Beach, and Newport Beach also show high household incomes beside one-year losses.
Site-derived lead. Sources: Census V2025 and ACS 2020-2024 median household income. One-year decline is total estimated population change, not a migration count or causal housing claim.
Ranked loss-and-income bars for eight high-income suburban cities.SVGPNG
Files reflect the same Vintage 2025 release as the full dataset. Use the data dictionary and source manifest when auditing fields or explaining joined context datasets to an editor.
Every City in the USA graphics, rankings, story leads, and copy blocks on this page may be copied, republished, cropped, resized, modified, translated, and used commercially under Creative Commons Attribution 4.0.
Attribution can be any reasonable credit for the medium. For online use, include a link to https://www.everycityintheusa.com/atlas/2025-us-city-growth/; if you alter a graphic or excerpt, note that it was modified. Keep the Census source, Vintage 2025 label, reference date, and one-year estimate caveat with the material.
Suggested credit: Source: U.S. Census Bureau Vintage 2025 estimates. Graphics and analysis: Every City in the USA, licensed CC BY 4.0.
Reporter kit
Suggested attribution and reusable copy blocks
Suggested attribution
Every City in the USA, "2025 U.S. City Growth Atlas," https://www.everycityintheusa.com/atlas/2025-us-city-growth/. Graphics and analysis licensed CC BY 4.0. Data source: U.S. Census Bureau, Population Estimates Program, Vintage 2025 city and place estimates (reference date 2025-07-01).
Methodology note
All figures come from the U.S. Census Bureau's Population Estimates Program, Vintage 2025 city and place file, with a reference date of July 1, 2025. Percent-growth tables are limited to cities with at least 20,000 residents in the 2024 estimate to avoid small-base distortions. All comparisons are within the Vintage 2025 series, so 2024 and 2025 figures are directly comparable.
Caveat: These are total population change figures from a single Census estimate vintage. They are not migration counts, and a one-year change is not a trend.
Do not say: “moved in,” “migration surge,” or “official fastest-growing city in America” unless your story independently supports that wording. The Atlas ranks a documented slice of the Census release.
Copy-paste lede templates
{CITY}, {STATE} added {NUMERIC_CHANGE} residents between July 2024 and July 2025, reaching {POP_2025}, according to Census Bureau Vintage 2025 estimates.
{CITY}, {STATE} grew {PERCENT_CHANGE} from July 2024 to July 2025 among cities with at least 20,000 residents in the 2024 estimate.
{CITY}, {STATE} crossed {THRESHOLD} residents in the Census Bureau Vintage 2025 estimates, reaching {POP_2025} as of July 1, 2025.
{CITY}, {STATE} recorded a one-year population decline of {NUMERIC_DECLINE}, from {POP_2024} in 2024 to {POP_2025} in 2025.
In {STATE}, the fastest-growing city over 20,000 residents was {CITY}, which grew {PERCENT_CHANGE} from 2024 to 2025.
Share graphic briefs
Static chart copy for social and newsletters
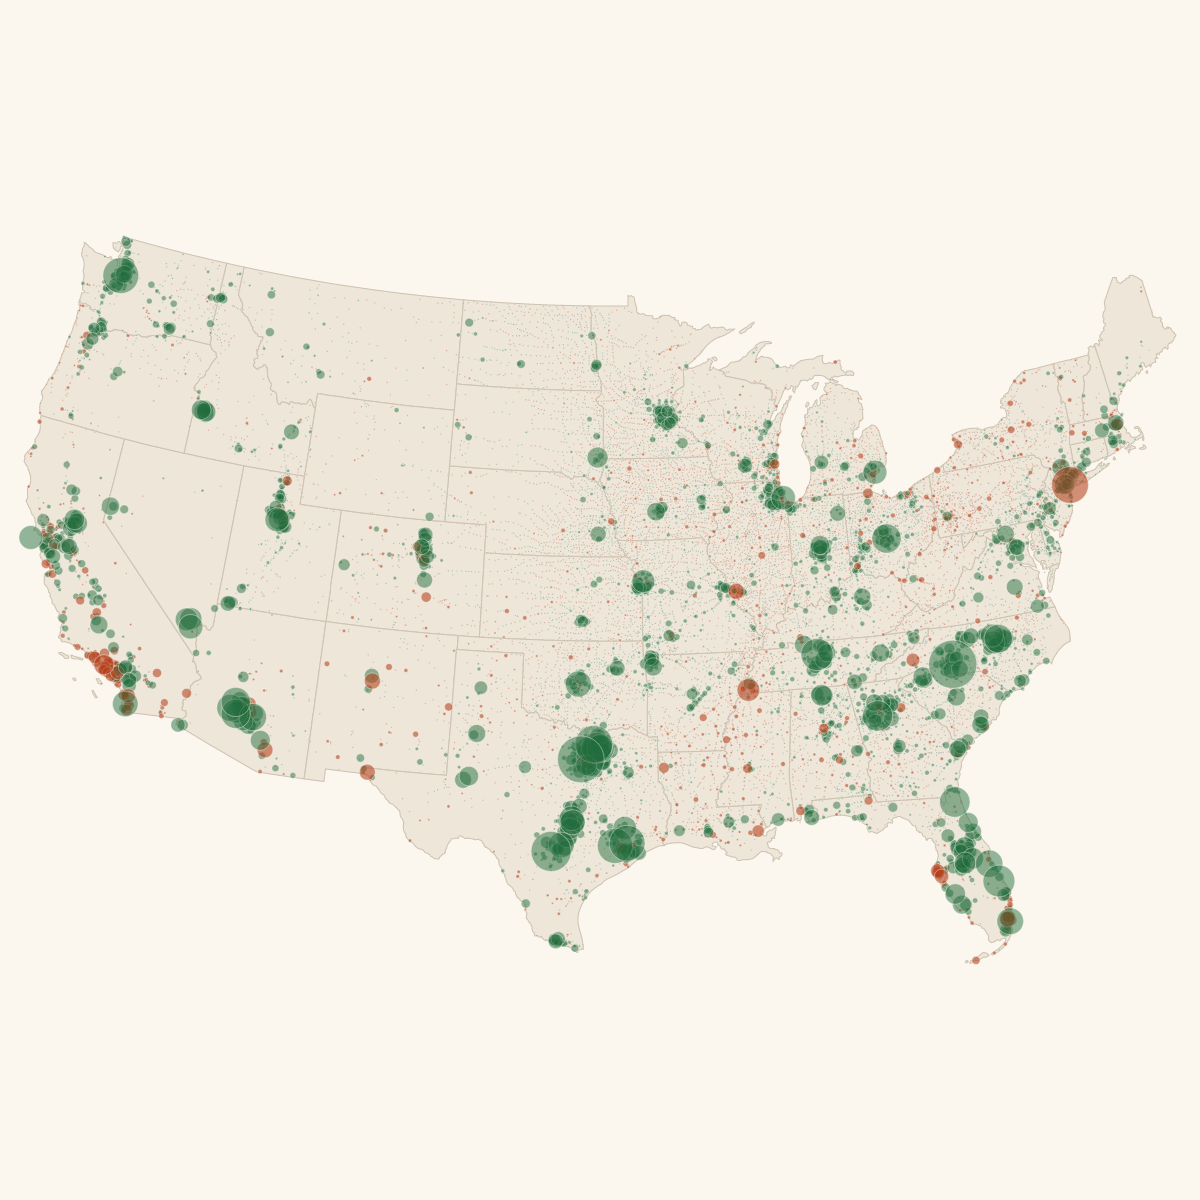
Where U.S. cities gained and lost residents
Every mapped city in Census Vintage 2025
Source: Census Bureau Vintage 2025. Circle area shows residents gained or lost.
Biggest numeric gainers, 2024 to 2025
Top 10 U.S. cities by residents added
Source: Census Bureau Vintage 2025. Charlotte, NC added +20,731 residents.
Cities that crossed a population milestone in 2025
The Atlas compares 2024 and 2025 estimates inside Census Vintage 2025. It does not compute 2010 to 2025 growth across the Vintage 2019 and Vintage 2025 seam, because those series use different base methodologies.


 Large cities and high absolute moves dominate this view.


