
U.S. rent and regional price data
Compare regional price levels and HUD rent benchmarks across United States areas. Download the Excel workbook and CSVs.
- 536 regional price records with source geography and units
- 4,680 county/town rent records plus 51,655 ZIP-area rent records
- Excel and CSV with field definitions and sources
One-time purchase · Refund policy
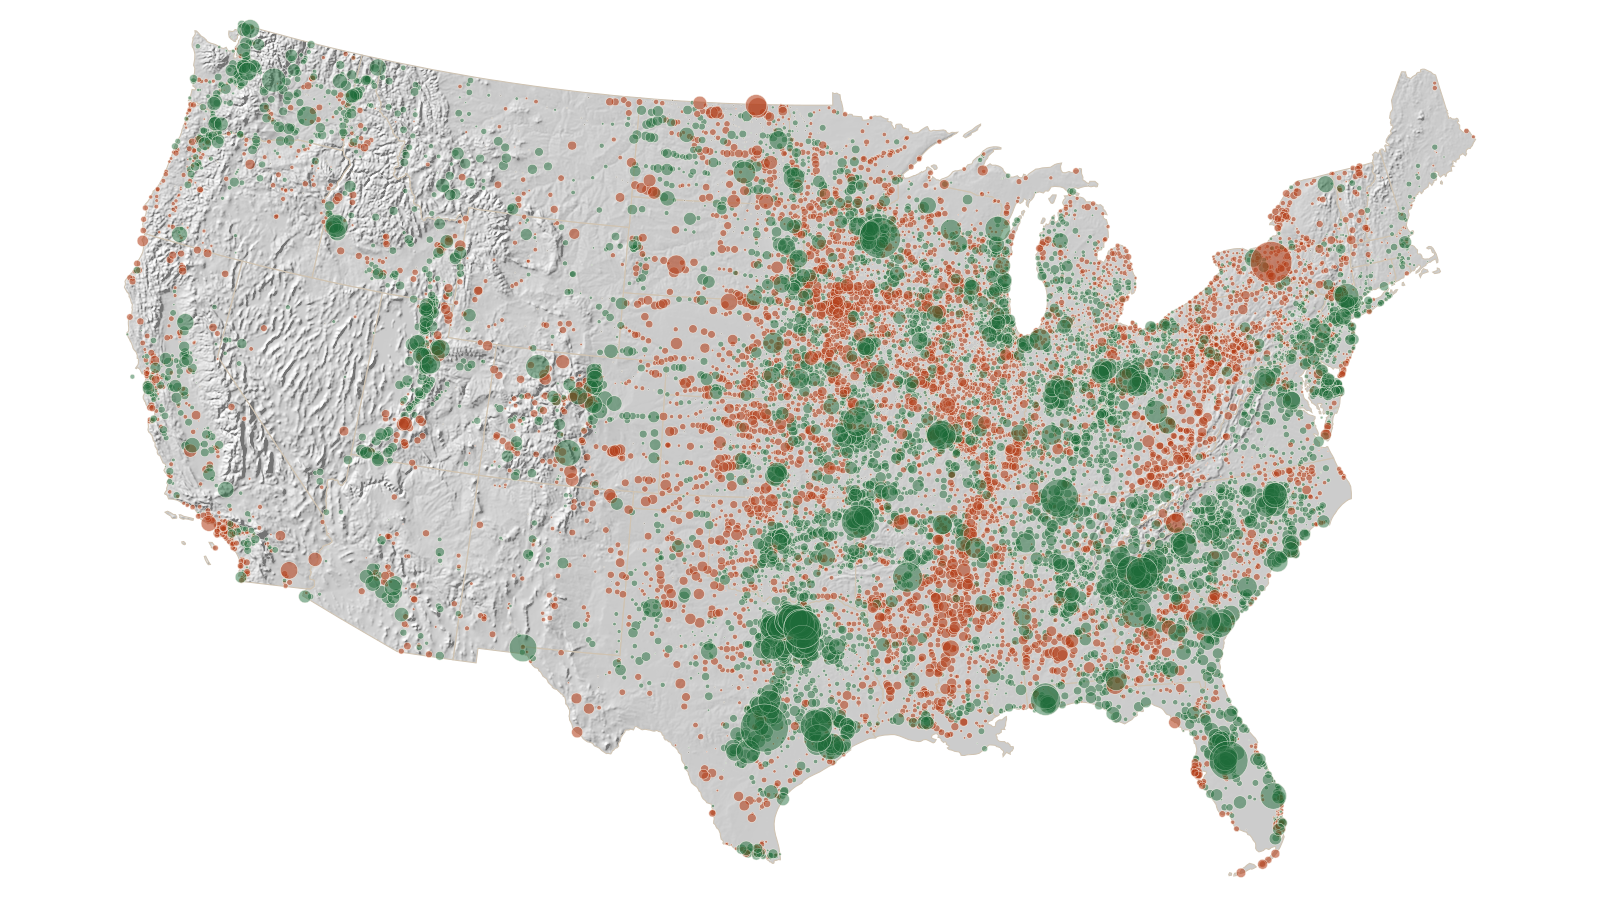
City population change, 2024 to 2025. Green dots gained, rust dots lost, gray dots did not change. The motion is illustrative, not a time series.
Contiguous U.S. PEP cities, a subset of the package. Sources: U.S. Census Bureau PEP, Vintage 2025; shaded relief from USGS 3DEP.
Regional prices and rent benchmarks
- Price and rent benchmarks
- BEA regional price indexes and HUD gross-rent benchmarks for studios through four-bedroom homes, in separate tables at their original geographic level.
- Files
- An Excel workbook, 4 CSV data tables and source documentation.
Live previewClose preview
Choose a file to browse every sample file and sheet.
Selected sample rows. Not a representative statistical sample.
| bea_table | bea_geo_fips | region_name | native_grain | region_state_fips | cross_state_area | reference_year | rpp_all_items |
|---|---|---|---|---|---|---|---|
| MARPP | 10180 | Abilene, TX (Metropolitan Statistical Area) | msa | 48 | false | 2024 | 90.364 |
| MARPP | 10420 | Akron, OH (Metropolitan Statistical Area) | msa | 39 | false | 2024 | 93.37 |
| MARPP | 10500 | Albany, GA (Metropolitan Statistical Area) | msa | 13 | false | 2024 | 87.669 |
| MARPP | 10540 | Albany, OR (Metropolitan Statistical Area) | msa | 41 | false | 2024 | 102.1 |
| MARPP | 10580 | Albany-Schenectady-Troy, NY (Metropolitan Statistical Area) | msa | 36 | false | 2024 | 99.566 |
| MARPP | 10740 | Albuquerque, NM (Metropolitan Statistical Area) | msa | 35 | false | 2024 | 95.546 |
| MARPP | 10780 | Alexandria, LA (Metropolitan Statistical Area) | msa | 22 | false | 2024 | 85.686 |
| MARPP | 10900 | Allentown-Bethlehem-Easton, PA-NJ (Metropolitan Statistical Area) | msa | 34|42 | true | 2024 | 99.968 |
Read-only examples from the download. Sorting and search apply to these sample rows, not the full files.
Only in the sample download, not in the full package:
- sample_manifest.json
- Faithful sample selection and full-release pins; sample counts describe only the sample.
Questions before you buy
What does the package cover?
Native HUD rents and BEA regional prices across the fifty states and D.C. Puerto Rico and other territories are excluded. These are program benchmarks and native regional price levels, not measured prices for every city.
- Applicable FY2026/FY2027 rents; inspect fiscal_year, effective_date and effective_status by row; official notices reviewed October 19, 2026
- U.S. Department of Housing and Urban Development
- 2024 regional price parities; published native regions; source zero placeholders are not valid prices
- U.S. Bureau of Economic Analysis
- July 2023 CBSA delineations
- U.S. Office of Management and Budget, CBSA delineations
HUD ZIP codes are not universally Census ZCTAs. Cross-state regional values describe the whole source area. No nearest-centroid city rent estimates are included. Every City in the USA is independent and not affiliated with BEA or HUD.
What's included in the download?
An Excel workbook, 4 CSV data tables and source documentation. Full files and sample files use the same columns. Every file is listed below.
13 files. 12 are previewed in the sample above. The rest are marked Not in the sample.
- cost_of_living_rent.xlsx
- Excel sheets matching the three separate HUD/BEA native-geography tables. No city allocation or interpolation is applied.
- CITATION.txt
- Source agencies, vintages and citation instructions for this release.
- LICENSE.txt
- The approved named-release evaluation license for simulated-payment testing.
- README.md
- How to use the files, with source coverage, units and limitations.
- SOURCE_LINEAGE.json
- Accepted source references, source vintages, rights decisions and transformations.
- coverage_report.json
- Geography coverage, native counts and limitations for this full package or sample.
- field_dictionary.json
- Field definitions, units, text identifiers and missing-value rules.
- hud_geography_rents.csv
- Native HUD county/town and separately coded county-portion memberships. hud_county_prefix is a HUD source prefix, not a guaranteed Census county FIPS; HUD 29056 is Sullivan city part of Crawford County, Missouri, Census 29055. Read fiscal_year and effective_date by row.
- hud_zip_rents.csv
- Applicable HUD FY2026/FY2027 rents, reviewed October 19, 2026. ZIP plus HUD area is the key; whole intersecting source areas retain cross-state rows. Two Grafton County NH ZIPs retain FY2026 separately. This is not a complete USPS directory.
- regional_price_coverage.csv
- Complete selected native BEA regional universe and all five original source strings. Four national nonmetro partitions contain only zero placeholders, have no valid published index, and are excluded from price arithmetic. Zero does not establish geographic absence.
- regional_price_indexes.csv
- BEA 2024 price levels for whole United States-intersecting metropolitan areas and state/metro/nonmetro totals. U.S. = 100; these are not inflation rates or household budgets.
- SHA256SUMS
- SHA-256 checksums for the files in this particular archive.
- PACKAGE_MANIFEST.json
- Full package identity, source vintages, file hashes and publication state.Not in the sampleThe full-package manifest records the complete download; the sample has its own sample_manifest.json.
The field dictionary in each release is the authoritative column list.
How does the sample relate to the full package?
Sample rows come from the full release, with the same columns and workbook sheets. Sample documentation describes its scope and selection. The sample is for inspecting the files, not a representative statistical sample.
How should I read the numbers?
Regional price indexes compare places, not inflation over time. HUD rents are benchmarks, not current listings or guaranteed voucher payments. Source years and effective-date exceptions are documented in the files. The regional coverage table preserves source zero placeholders and explains unavailable price indexes. These records never become zero prices. Read the methodology and source files before comparing estimates.
Can I buy a single state?
Choose the geography you need.
- Alabama
- Alaska
- Arizona
- Arkansas
- California
- Colorado
- Connecticut
- Delaware
- Florida
- Georgia
- Hawaii
- Idaho
- Illinois
- Indiana
- Iowa
- Kansas
- Kentucky
- Louisiana
- Maine
- Maryland
- Massachusetts
- Michigan
- Minnesota
- Mississippi
- Missouri
- Montana
- Nebraska
- Nevada
- New Hampshire
- New Jersey
- New Mexico
- New York
- North Carolina
- North Dakota
- Ohio
- Oklahoma
- Oregon
- Pennsylvania
- Rhode Island
- South Carolina
- South Dakota
- Tennessee
- Texas
- Utah
- Vermont
- Virginia
- Washington
- West Virginia
- Wisconsin
- Wyoming
How do purchase and access work?
- Complete checkout. No account needed.
- Open your emailed download link to access your library.
- Download from your library, including corrections to your release.
One named release and its corrections. Future editions are not included.
Use of the package follows the license. Refunds follow the refund policy. Hosted redownloads follow the hosted retention policy; keep a local copy of the files you download.
Buy the package
Checking availability
Already bought it? Open your library.